
Chapter 3
Viewer tools
This chapter describes the general-purpose tools of the viewer: identifying what lies at a point, measuring, drawing, querying data, downloading, printing, sharing a view and consulting sources and help. Monitoring analyses, hotspots and historical imagery are explained in chapters 5 to 8.
Only one panel tool is active at a time. The Esc key closes the open panel or menu.
Identify
“Identify” is active by default: when you click on the map, the viewer shows the data of whatever lies at that point.
- Switch on one or more layers in the Table of Contents.
- Click on a feature on the map. The layers that are switched on are queried, from top to bottom.
- Read the attribute card. The “View details” button opens the feature detail, with actions such as “Zoom to extent”, “Copy link”, “Area of influence” and, when the feature is a polygon, “Detect changes here”.
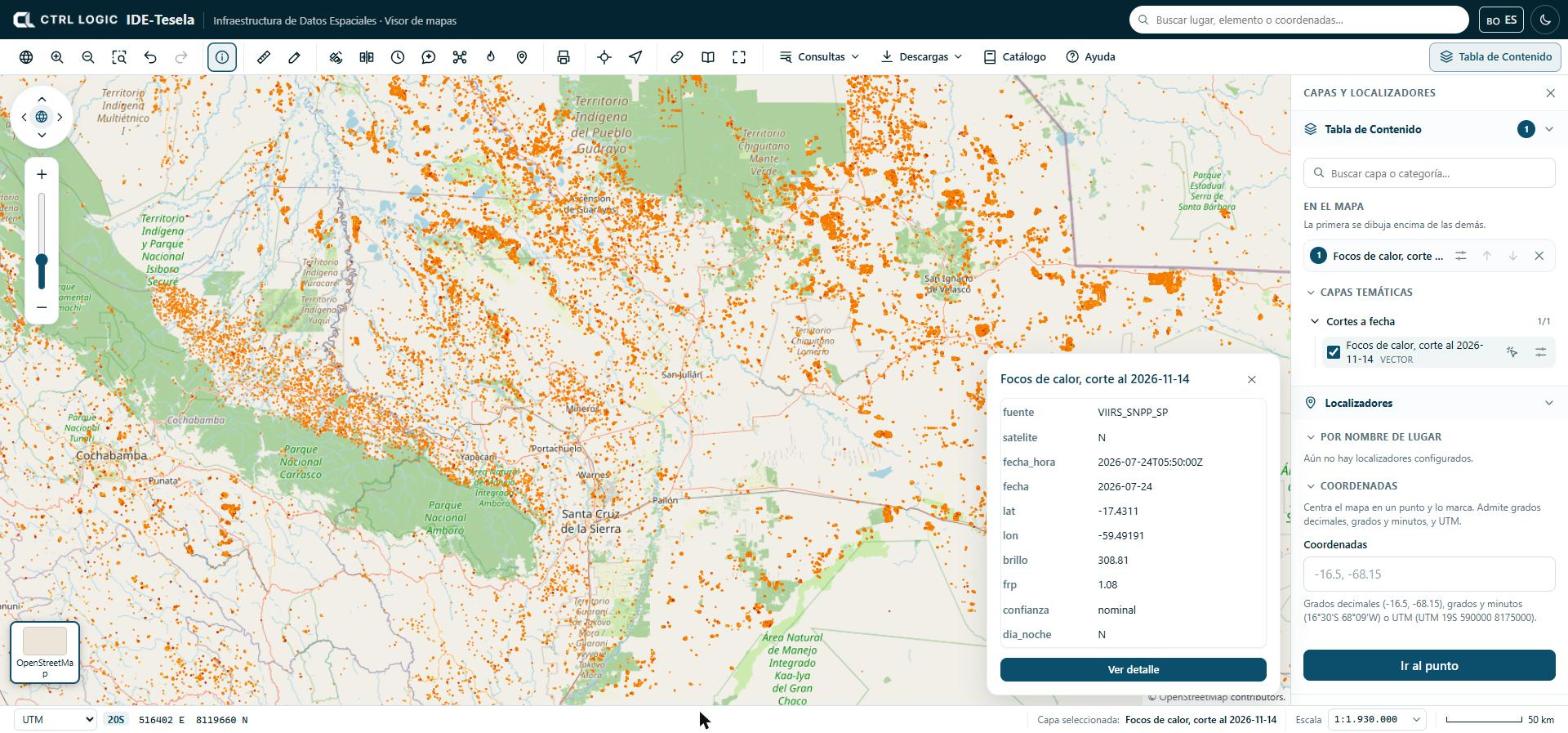
If several layers are switched on and you are interested in only one, click that layer’s “Queryable” icon in the Table of Contents.
Measure
The “Measure” tool calculates distances and areas on the Earth’s surface, not on the flat map.
- Click “Measure” and choose “Distance” or “Area” in the panel.
- Click on the map to mark each point. For an area you need at least three vertices.
- Double-click to finish. The Backspace key removes the last point.
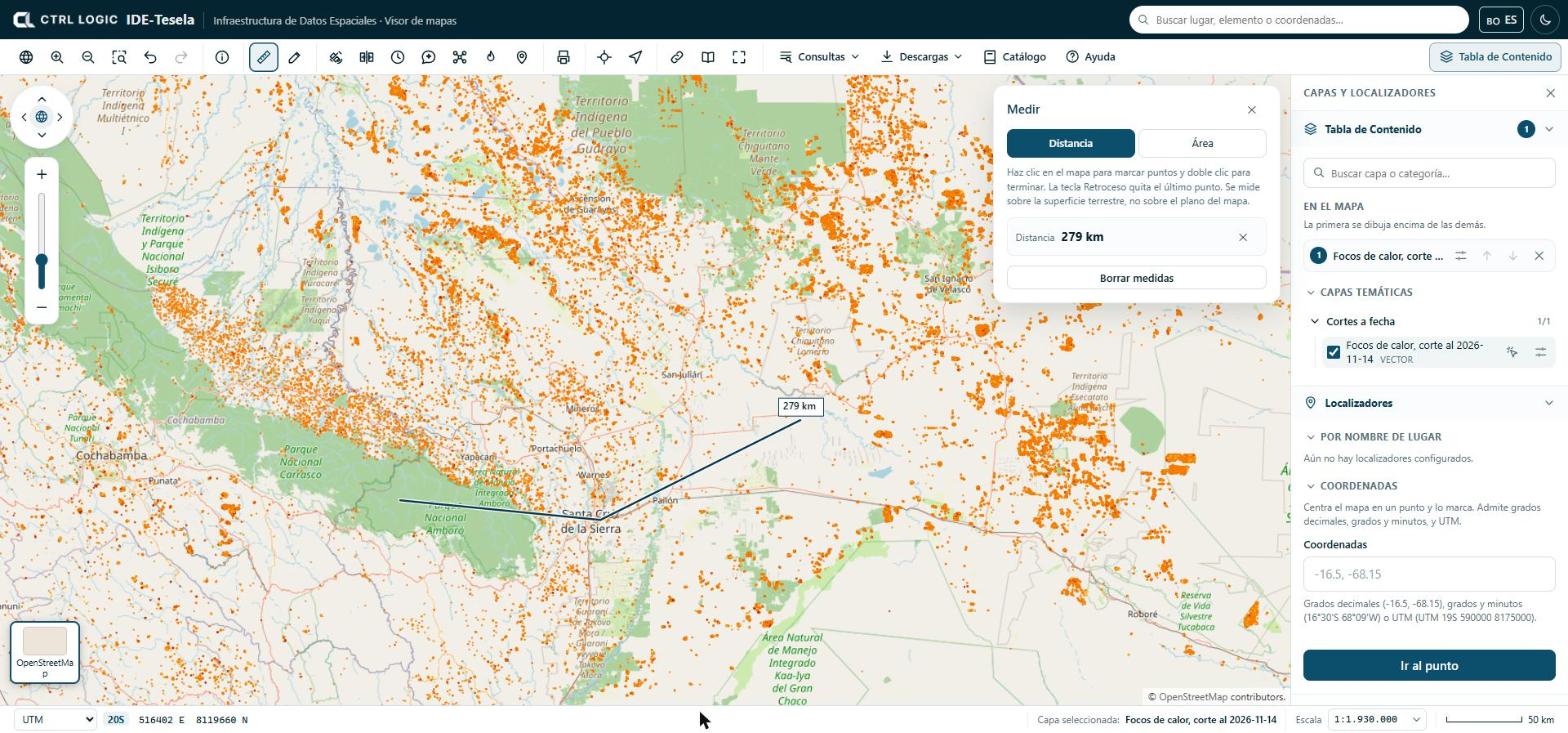
For area measurements the panel also offers the perimeter, the centroid and the “Vertices” table, with the “Copy coordinates” button to paste them into a spreadsheet or a report.
Draw and annotate
“Draw” is used to mark features on the map while you work. The types are “Point”, “Line”, “Area”, “Circle” and “Text”; “Edit” lets you move vertices or entire drawings.
- Click “Draw” and choose the type. The panel explains how each one is drawn (for example, click on each vertex and double-click to finish).
- Choose the color and, depending on the type, the line width or the text size. For a text, type it in the panel and click where you want to place it.
- Review your drawings in the panel list or under “My drawings” in the Table of Contents. To delete them all, click “Delete all” and confirm.
Drawings are saved only in your browser and appear in printouts. They do not travel in the link you share and other people cannot see them.
Area drawings also serve as an input zone for “Monitoring” (chapter 5).
“Queries” menu
The “Queries” menu groups the queries on the data:
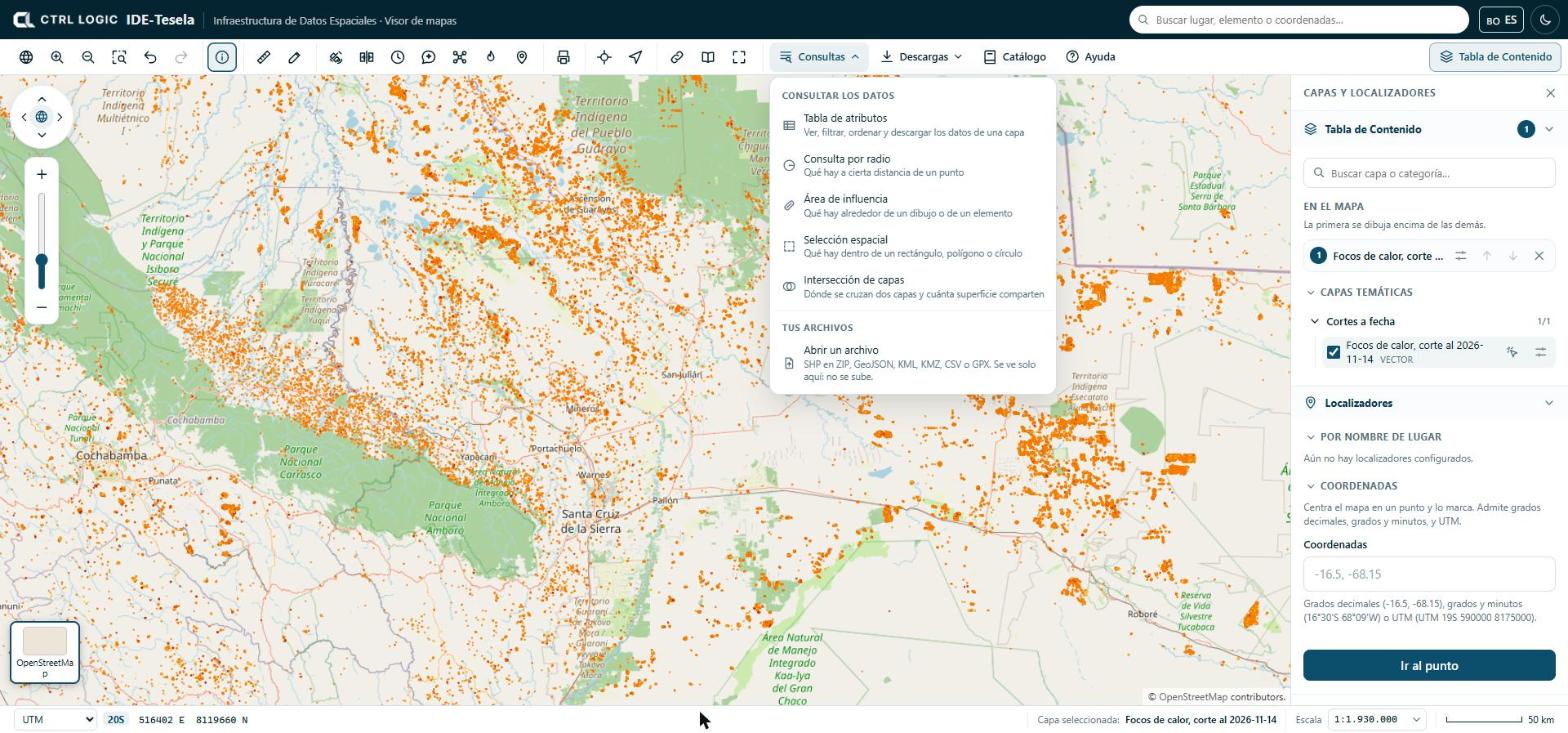
- Attribute table: view, filter, sort and download a layer’s data.
- Radius query: what lies within a given distance of a point.
- Area of influence: what lies around a drawing or a feature.
- Spatial selection: what lies inside a rectangle, polygon or circle.
- Layer intersection: where two layers overlap and how much area they share.
- Open a file: shows your own file on the map (zipped SHP, GeoJSON, KML, KMZ, CSV or GPX). You can also drag it onto the map.
Your own files are read in your browser: they are not uploaded anywhere and only you can see them. A maximum of five can be open at the same time. If a CSV has no recognizable coordinate columns, the viewer asks you which ones they are and which coordinate system they use.
“Downloads” menu
“Downloads” acts on the selected layer and on the current map. If no layer is switched on, it tells you so.
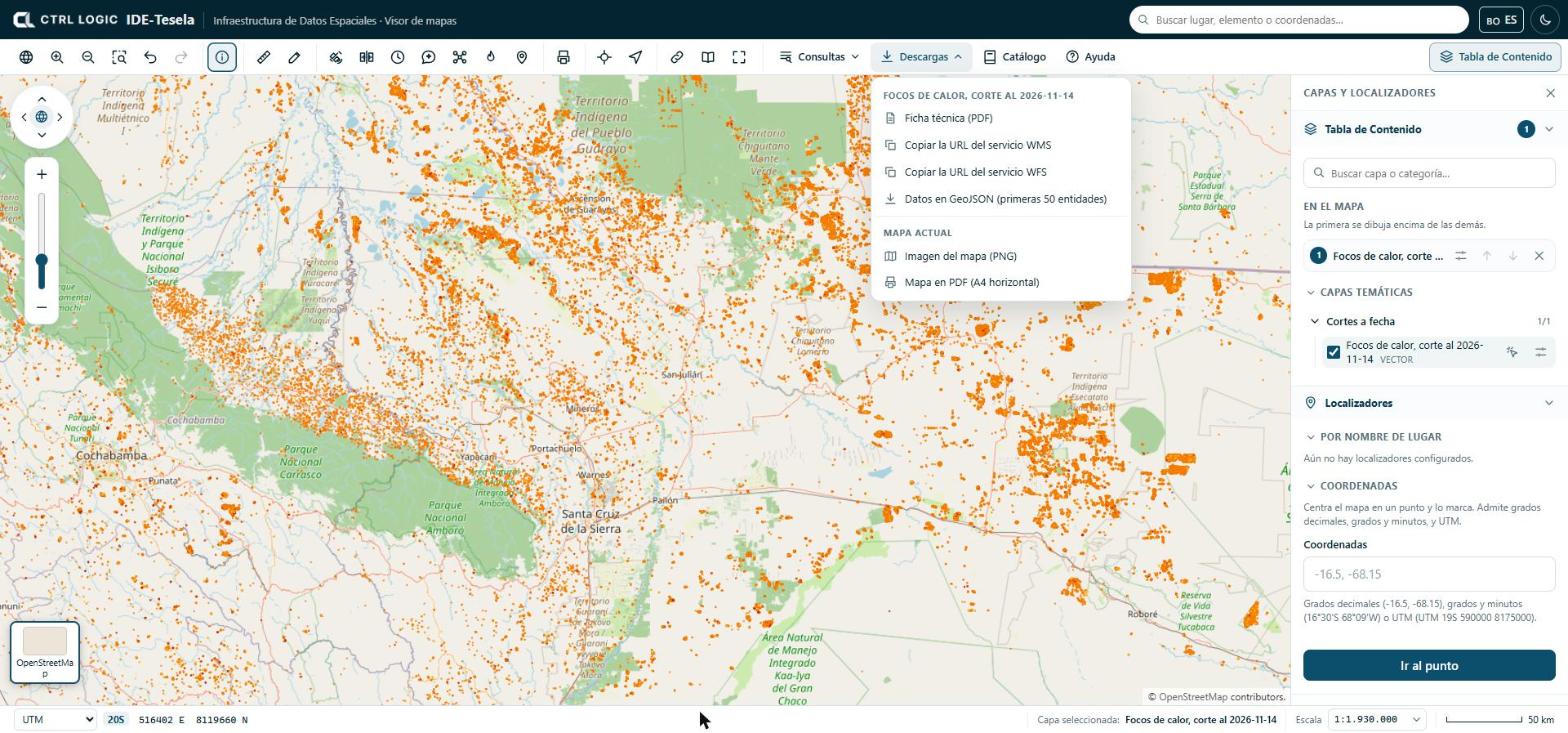
- Layer technical sheet (PDF).
- Copy the WMS service URL and Copy the WFS service URL, to add the layer in QGIS or another GIS program.
- Data as GeoJSON, limited to the first features of the layer (the menu shows the number).
- Map image (PNG) and Map as PDF (A4 landscape), of what you see on screen.
Downloads are recorded in the system audit trail.
Print or export
The “Print” tool prepares a map in document format.
- Click “Print” and enter the “Map title”.
- Choose the paper (A4 or A3) and the orientation (Landscape or Portrait).
- Tick “Include the legend of the active layers” if you want it.
- Click “Download PDF”, or “PNG image” / “JPG image” for a capture of the map as it appears.
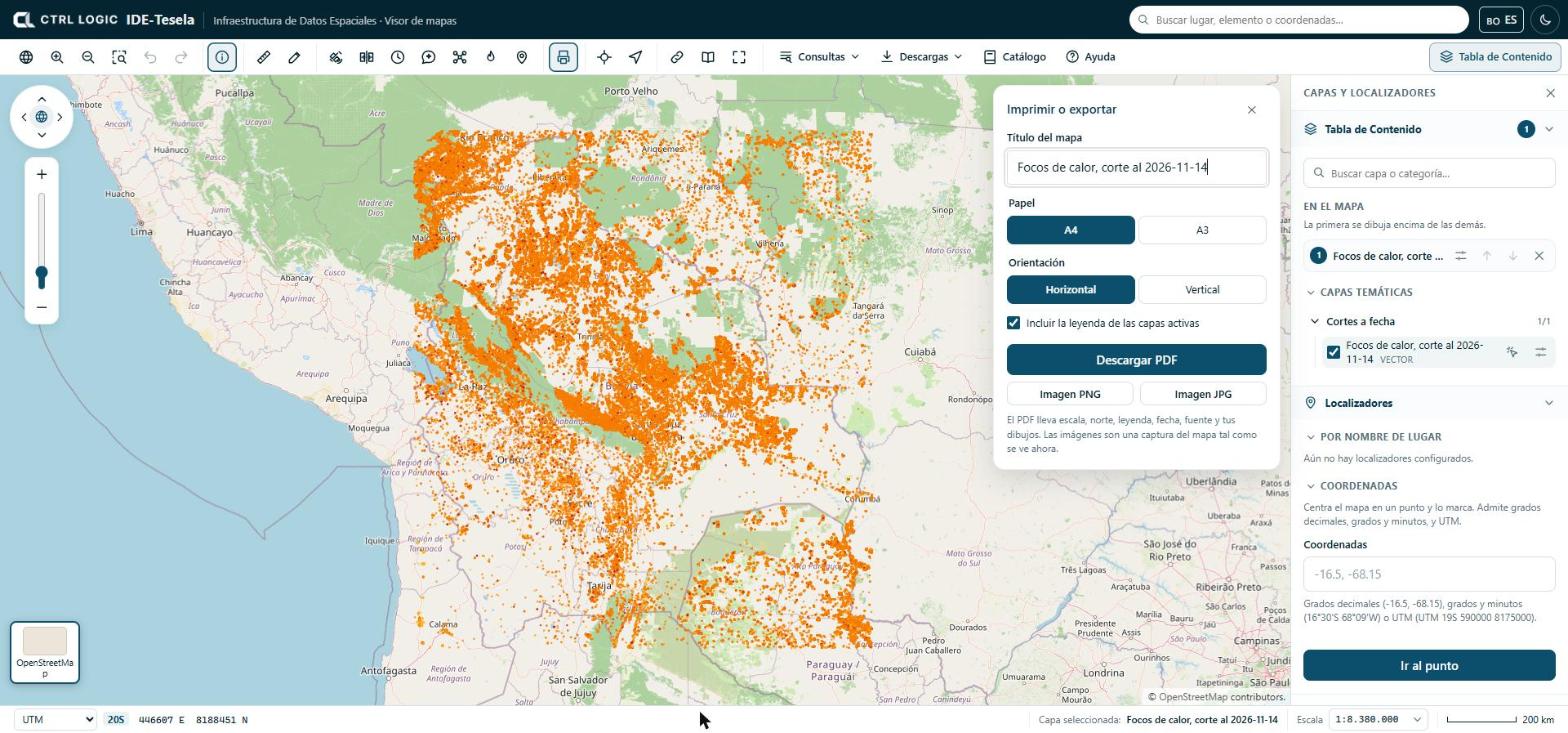
The PDF is a reference document. It does not replace official cartography and has no validity for legal procedures. If a layer takes too long to load, the PDF may come out incomplete and the system warns you.
Share this view
“Share” generates a link that opens the viewer with the same extent, the same base map and the same layers, in the same order and with the same opacity. Click “Copy link” and paste it into an email or a report. Your drawings do not travel in the link.
Full screen, sources and help
- Full screen enlarges the viewer; if the browser does not allow it, try the F11 key.
- Sources opens the “Sources and licenses” panel: origin, license, attribution, version and download date of the third-party data used by Tesela. When you reuse a dataset, cite the source as indicated.
- Help opens “How to use the viewer”, a short guide to movement, layers, queries, scale and keyboard shortcuts.
Summary
- “Identify” shows the attributes of whatever lies where you click.
- “Measure” calculates on the Earth’s surface; “Draw” annotates the map and saves drawings only in your browser.
- “Queries” offers the attribute table, spatial queries and your own files, which are not uploaded.
- “Downloads” and “Print” produce sheets, services, images and PDFs; “Share” copies a link to the current view.
- “Sources” and “Help” are always at hand on the toolbar.