
Chapter 6
Burns and severity
Burn analysis estimates the severity of areas with indications of burning by comparing a period before and a period after the fire. It uses the dNBR index calculated from Sentinel-2 imagery at 20 m. Like the rest of the detection, it is mathematical and explainable (no artificial intelligence), and its result is an estimate that requires verification: it does not indicate the cause of the burn or its legality.
What dNBR is
The NBR (Normalized Burn Ratio) combines two Sentinel-2 bands: the near infrared (B8A), where healthy vegetation reflects strongly, and the shortwave infrared (B12), which responds to soil and moisture. In a burned area the NBR drops. The dNBR is the difference between the NBR of the earlier period and that of the later period: the higher it is, the greater the alteration of the cover.
The severity classes derive from dNBR thresholds based on the USGS:
| Class | dNBR (initial threshold) |
|---|---|
| Vegetation regrowth | below −0.1 |
| Low severity | from 0.1 |
| Moderate-low severity | from 0.27 |
| Moderate-high severity | from 0.44 |
| High severity | from 0.66 |
These values are set by the burn domain template. The sheet of each analysis shows the thresholds that were used.
How to request it
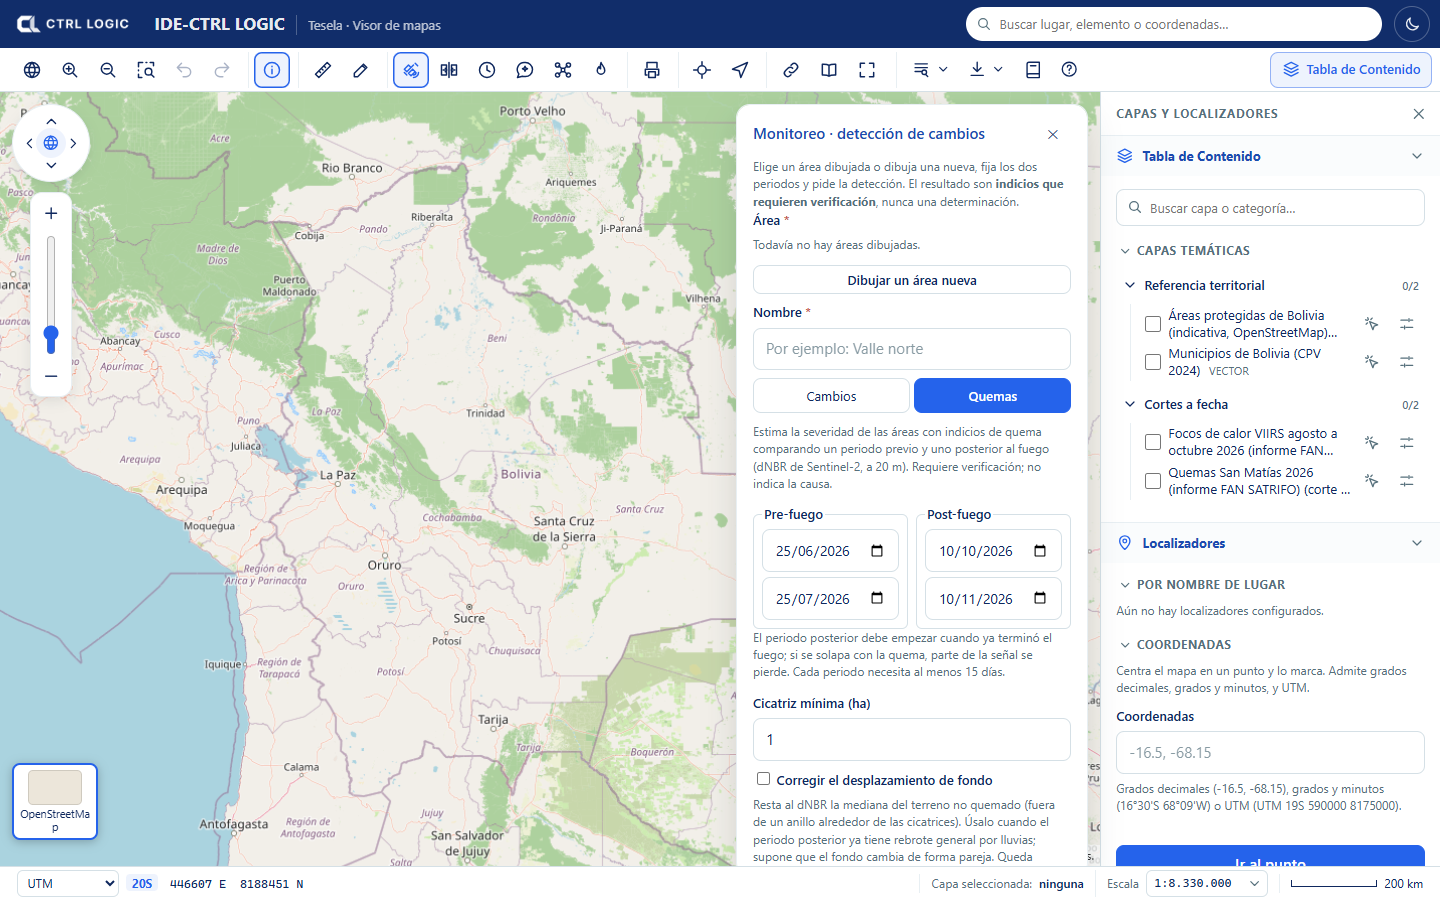
- Open “Monitoring” on the toolbar, choose or draw the area and enter a name (as in chapter 5).
- Click the “Burns” tab.
- Set the Pre-fire period (start and end) and the Post-fire period. The later period must start when the fire has already ended: if it overlaps with the burn, part of the signal is lost. Each period needs at least 15 days.
- Enter the “Minimum scar (ha)”: smaller patches are discarded. The initial value is 1 ha.
- If the later period already shows general regrowth caused by rain, consider ticking “Correct background offset” (see below).
- Click “Estimate burn severity”. The job goes through stages (preparation, composites, indices, vectorization and cross-referencing with municipalities and protected areas) and finishes in a few minutes.
Background correction
Between two dates, vegetation may turn green or dry out across the whole area, not only where there was fire. “Correct background offset” subtracts from the dNBR the median of the unburned terrain (the terrain outside a ring around the scars). It assumes that the background changes uniformly. If there is very little background terrain, or the offset is too large to be a background effect, the correction is not applied and the sheet says so. Whether or not it is applied is recorded in the analysis.
How to read the sheet
When you open the sheet of a burn analysis, the header shows the periods and the “Requires verification” label.
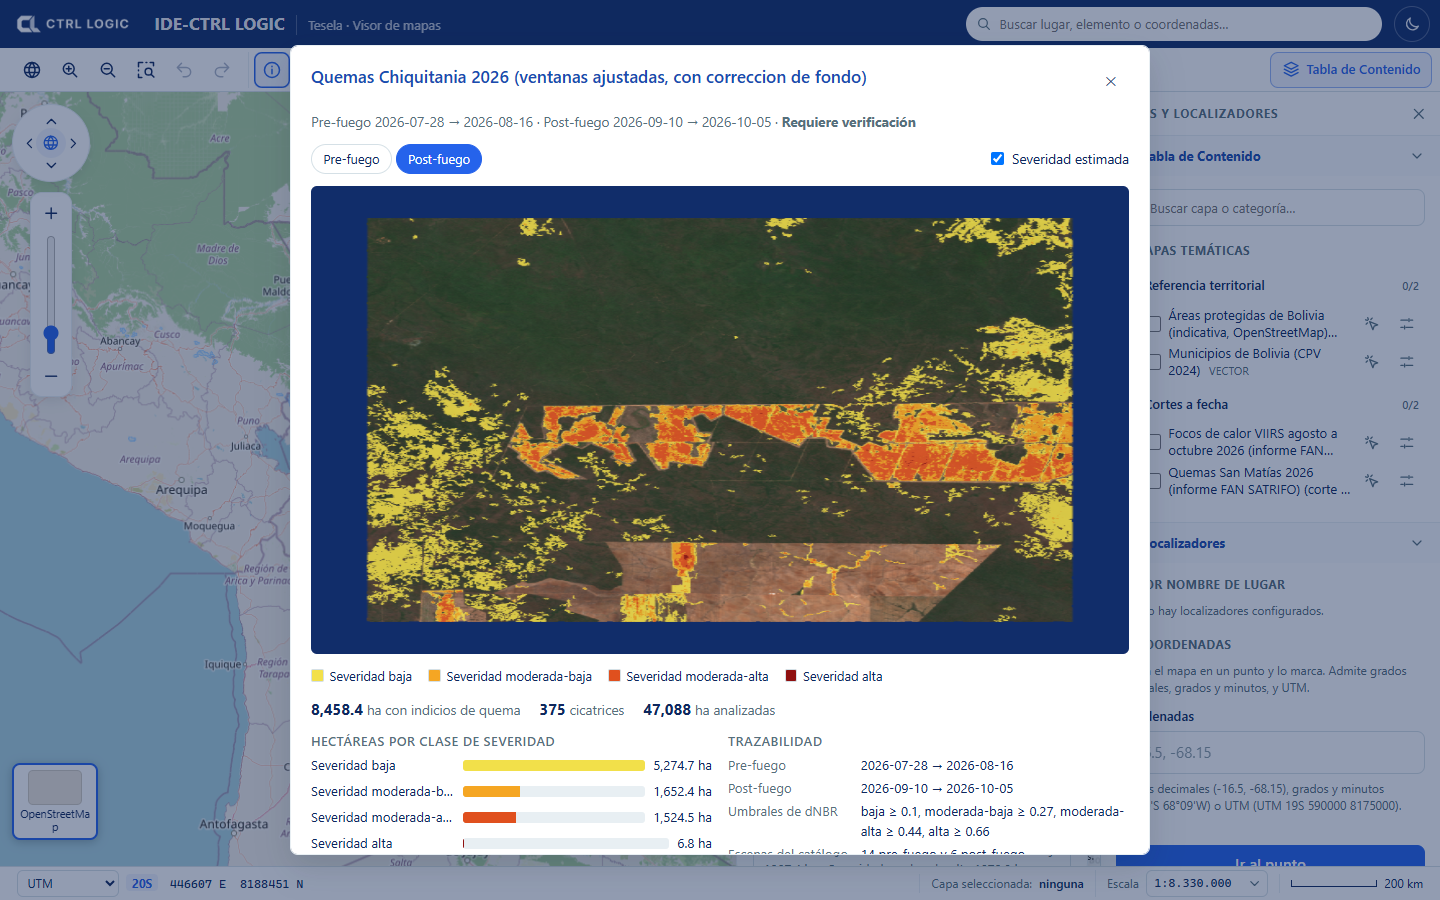
- Image: switches between “Pre-fire” and “Post-fire” (natural color); the “Estimated severity” checkbox overlays the scars colored by class.
- Figures: hectares with indications of burning, number of scars and hectares analyzed.
- Hectares by severity class: how much area falls in each class.
- Traceability: periods, dNBR thresholds used, catalog scenes employed, percentage of no-data pixels, status of the background correction, creation date and imagery source.
- Municipalities and protected areas with the most hectares: cross-reference with the reference layers. Hectares are calculated in an equal-area projection.
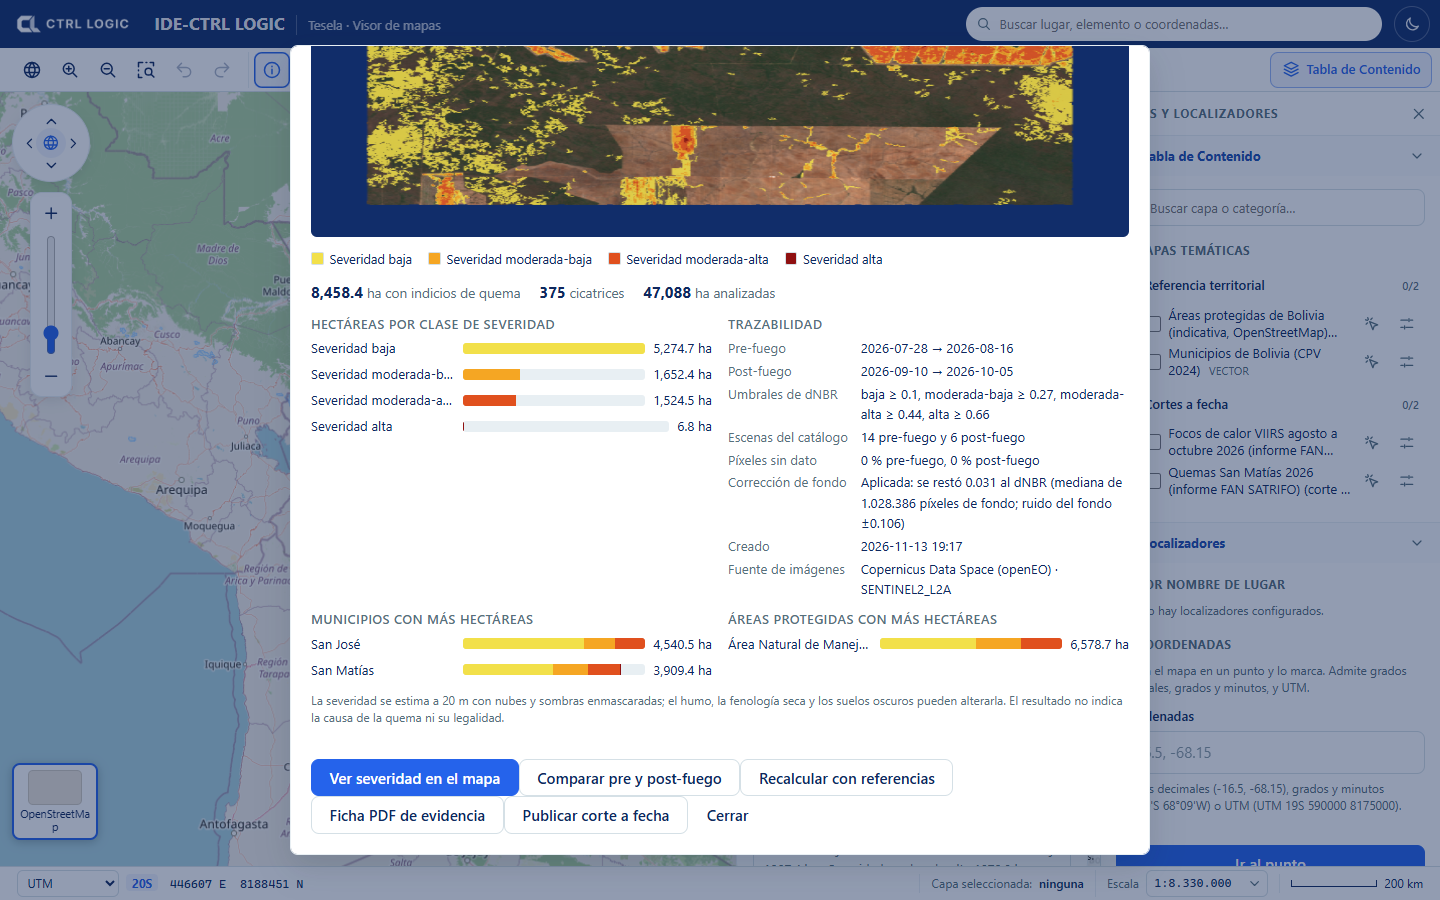
The protected areas in the demonstration come from OpenStreetMap and are indicative: they may omit areas and their boundaries are not the official ones. A spatial coincidence between a scar and an area or a municipality implies no cause or responsibility whatsoever.
Sheet actions
- “View severity on the map”: switches on the severity as a viewer layer.
- “Compare pre and post-fire”: opens the comparison tool with the two images (chapter 8).
- “Recalculate with references”: redoes the cross-references with municipalities and protected areas using the layers loaded now, without downloading imagery again. Useful if those layers were loaded after the analysis.
- “Evidence sheet (PDF)”: generates the PDF with the results and their traceability.
- “Publish snapshot” (depending on permissions): freezes the result as a snapshot (chapter 12).
How to interpret with caution
- The scars are indications of burning. The sheet states expressly that the result does not indicate the cause of the burn or its legality.
- Severity is estimated at 20 m, with clouds and shadows masked. Smoke, dry-season phenology and dark soils can alter it.
- Without calibration against known cases in the region, severity may be underestimated.
- Cross-check with hotspots (chapter 7) and, where it matters, with verification in the field.
Summary
- Burn analysis compares a pre-fire and a post-fire period using Sentinel-2 dNBR at 20 m.
- The result is classified as low, moderate-low, moderate-high and high severity, with hectares per class, per municipality and per protected area.
- The background correction is optional and is recorded.
- The sheet preserves traceability: periods, thresholds, scenes, no-data pixels and source.
- It is an estimate that requires verification; it indicates neither cause nor legality.