
Tesela · User manual
CTRL-LOGIC territorial monitoring platform
The data in the screenshots is demonstration data. Every Tesela result is an indication that requires verification; the system does not determine the cause or the legality of what it detects.
Contents
- 1. Introduction to Tesela
- 2. The map viewer
- 3. Viewer tools
- 4. Third-party layers
- 5. Change detection
- 6. Burns and severity
- 7. Heat hotspots
- 8. Historical imagery and layer comparison
- 9. Drone mission
- 10. “Ask the map” assistant
- 11. Field: observations from the ground
- 12. Snapshots and sources
- 13. Catalog and layers
- 14. Users, profiles and audit
- 15. System settings
- 16. FAQ, glossary and limits
Chapter 1
Introduction to Tesela
The screenshots show the Spanish interface; the same screens are available in English and Portuguese from the language selector.
Tesela is a territorial monitoring platform from CTRL-LOGIC. It is used to watch how a territory changes over time: it compares satellite images, calculates indices, delineates areas with alterations, cross-references them with reference layers (municipalities, protected areas) and takes them to a map viewer where authorized people review them. This chapter explains what the system is and is not, how to sign in and how to find your way around the interface.
What it is and what it is not
Tesela is a technical tool that supports management, analysis and oversight. It helps you decide where to look first.
- It does not determine illegality. It detects indications, alterations or activity consistent with… something, and always marks them as “requires verification”. The conclusion is reached by the competent institution through its own procedure.
- It does not replace field inspection or institutional systems: it is a layer that builds on them.
- It is not an official geoportal. A geoportal publishes information that has already been validated; Tesela produces new information that has not been validated yet.
- Detection does not use artificial intelligence. It relies on spectral indices and thresholds that can be read, repeated and explained. Artificial intelligence is used only in the “Ask the map” assistant, which queries data and is read-only (chapter 10).
Every Tesela result is an indication that requires verification. The system does not determine the cause or the legality of what it shows. The data in the screenshots in this manual is demonstration data.
How to sign in
- Open the Tesela address provided by your institution. The sign-in screen appears.
- Enter your institutional email and your password. The eye icon shows or hides the password as you type.
- Click “Sign in”.
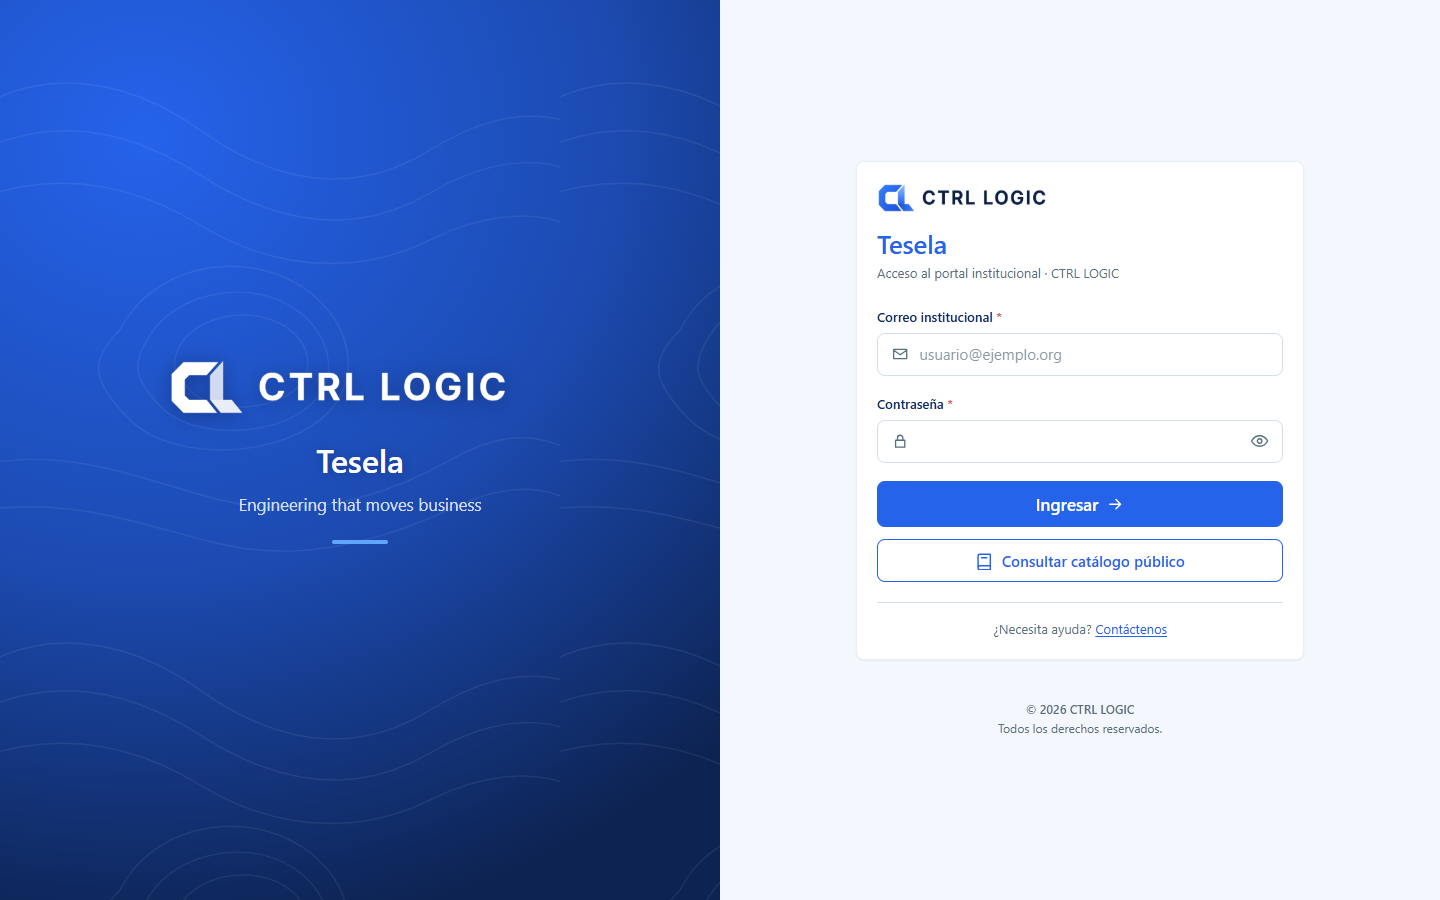
Other options on the sign-in screen:
- “Browse the public catalog”: enter without an account and see only what the institution has made public.
- “I forgot my password”: sends a six-digit code to your email, valid for 15 minutes, so you can choose a new password.
- “Create an account”: request registration if you do not have an account yet.
If an administrator gave you a temporary password, the system asks you to change it the first time you sign in. The new password must be at least 10 characters long, with lowercase letters, uppercase letters and at least one number.
Language and theme
At the top right of the system and of the viewer there are two controls:
- Language selector: a button showing the flag and code of the active language (ES, EN or PT). Click it to choose between Español, English and Português. Each language is written in its own language.
- Theme button: switches between light mode and dark mode (“Switch to dark mode” / “Switch to light mode”).
Interface texts are translated; layer titles are data and remain in their original language.
Map of the interface
Outside the viewer, the screens share one structure: a side menu on the left and a header at the top. On narrow screens the menu opens with the three-line button.
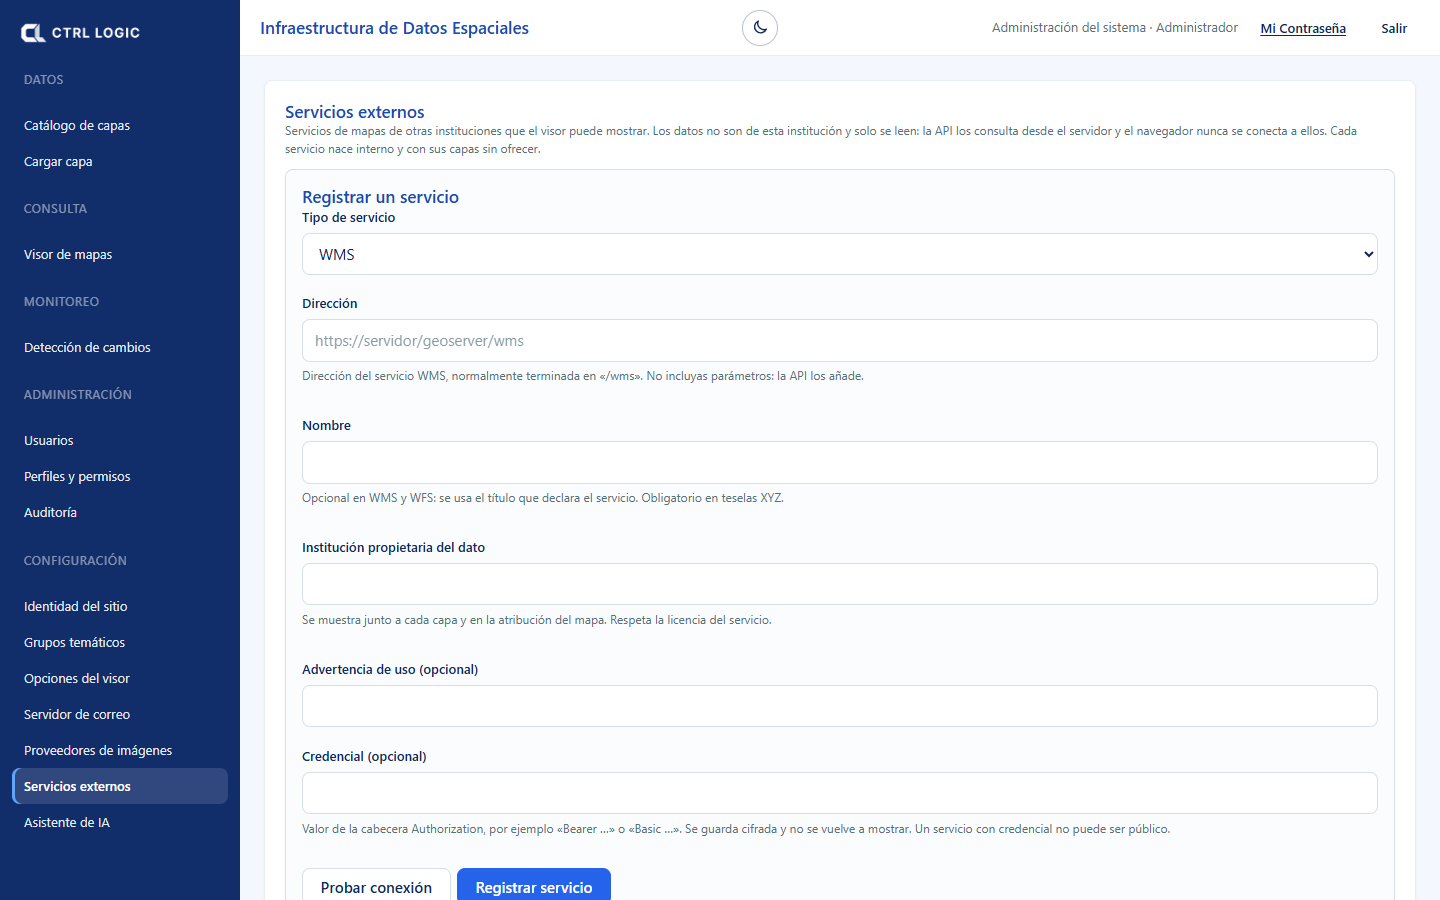
| Menu group | What it contains |
|---|---|
| Data | “Layer catalog” and “Upload layer” |
| Query | “Map viewer”, where most of the work takes place |
| Monitoring | “Change detection” |
| Administration | “Users”, “Profiles and permissions” and “Audit” |
| Settings | “Site identity”, “Thematic groups”, “Viewer options”, “Mail server”, “Imagery providers”, “External services” and “AI assistant” |
On the right of the header you see your name and profile, the “My Password” link to change your password and the “Sign out” button to end the session.
What you see depends on your profile
Each person has a profile with permissions. Whatever you are not permitted to use does not appear: if your profile cannot manage users, the “Administration” group is not in your menu; if it cannot upload data, you will not see “Upload layer” or “Change detection”. The same applies in the viewer, where an administrator decides, tool by tool, whether it is public, available only to signed-in users or hidden. If you need a function you cannot see, ask the system administrator for the permission.
Summary
- Tesela prioritizes areas for review; it does not determine illegality or causes.
- You sign in with email and password, or without an account through “Browse the public catalog”.
- The language (ES, EN, PT) and the light or dark theme are changed in the header.
- The side menu shows only what your profile can use.
Chapter 2
The map viewer
The viewer is the central screen of Tesela: a map with a toolbar, a layer panel and a status bar. From here you query layers, measure and draw features, request change analyses and compare images. This chapter explains its parts; the tools are described in detail in chapters 3 to 8.
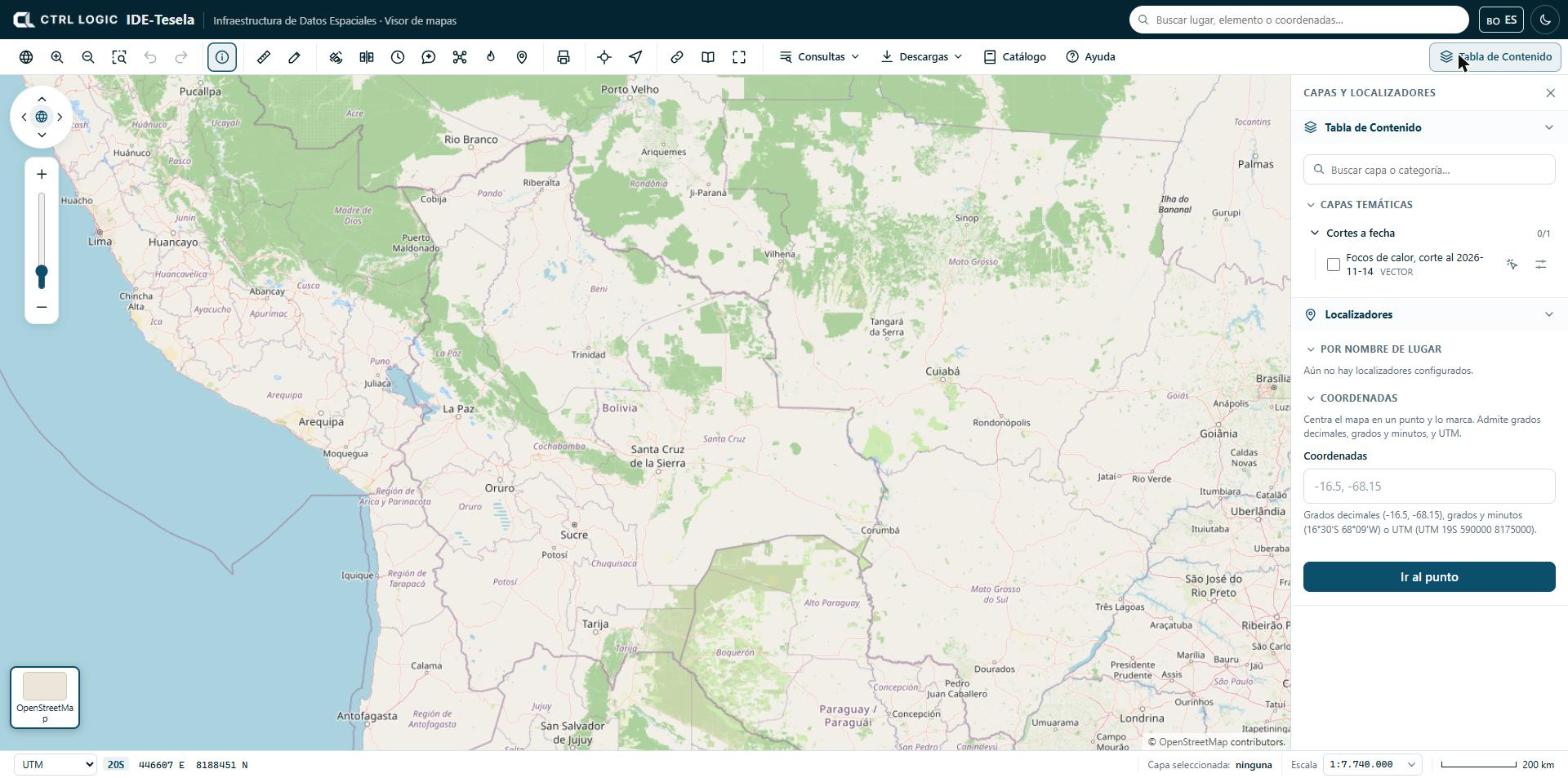
The toolbar
The toolbar sits below the header. Each button has a help text that appears when you hover over it. The buttons are grouped as follows:
| Group | Buttons |
|---|---|
| Navigation | “View all of Bolivia”, “Zoom in”, “Zoom out”, “Zoom to rectangle”, “Previous view” and “Next view” |
| Query | “Identify” |
| Measure and draw | “Measure” and “Draw” |
| Monitoring | “Monitoring” (detect changes), “Compare”, “Historical”, “Assistant”, “Drone” (drone mission), “Hotspots” and “Field” |
| “Print” | |
| Locate | “Go to…” (coordinates) and “My location” |
| Share | “Share”, “Sources” and “Full screen” |
| Menus | “Queries”, “Downloads”, “Catalog” and “Help” |
Not everyone sees every button. In “Viewer options”, an administrator defines which tools are public, which require a signed-in session and which are hidden. If a button is missing, your profile does not have it enabled.
The map also carries a navigation control (arrows to pan the map, a globe to return to the view of Bolivia and a zoom bar). With the map focused you can also use the keyboard arrow keys and the + and − keys.
The Table of Contents
The “Table of Contents” button (top right) opens and closes the “Layers and locators” panel. This is where layers are switched on and off.
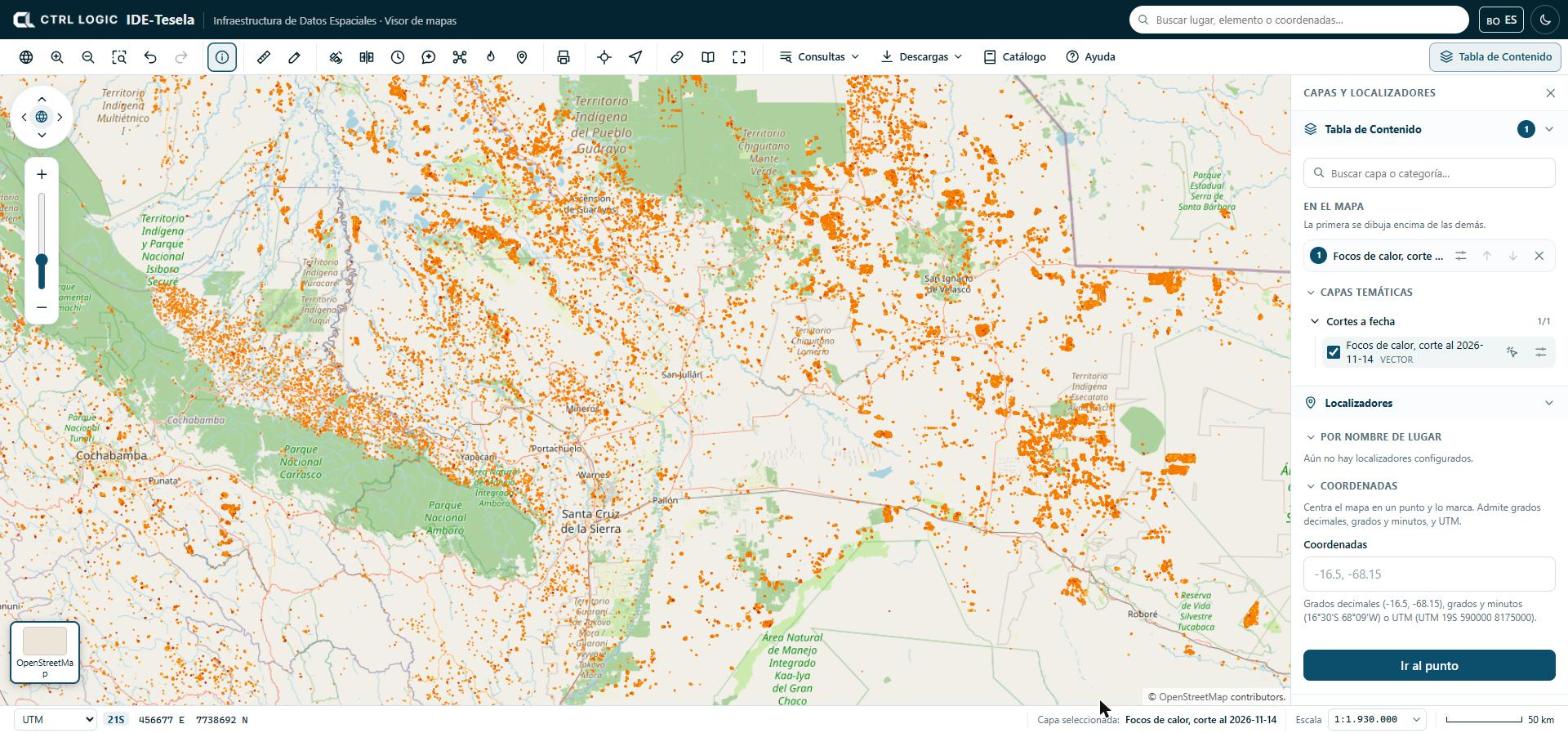
- Open “Table of Contents”. Layers are arranged in thematic groups (folders that expand; the counter, for example “0/1”, shows how many are switched on).
- Type in “Search layer or category…” to filter the list.
- Tick the checkbox of a layer to switch it on. Each layer shows whether it is vector or raster; layers visible only to signed-in users carry the “Internal” label.
- In the “On the map” section, order the layers that are switched on: the first one in the list is drawn on top of the others. Use the arrows to move a layer up or down and the ✕ to remove it.
The options button of each layer expands its settings:
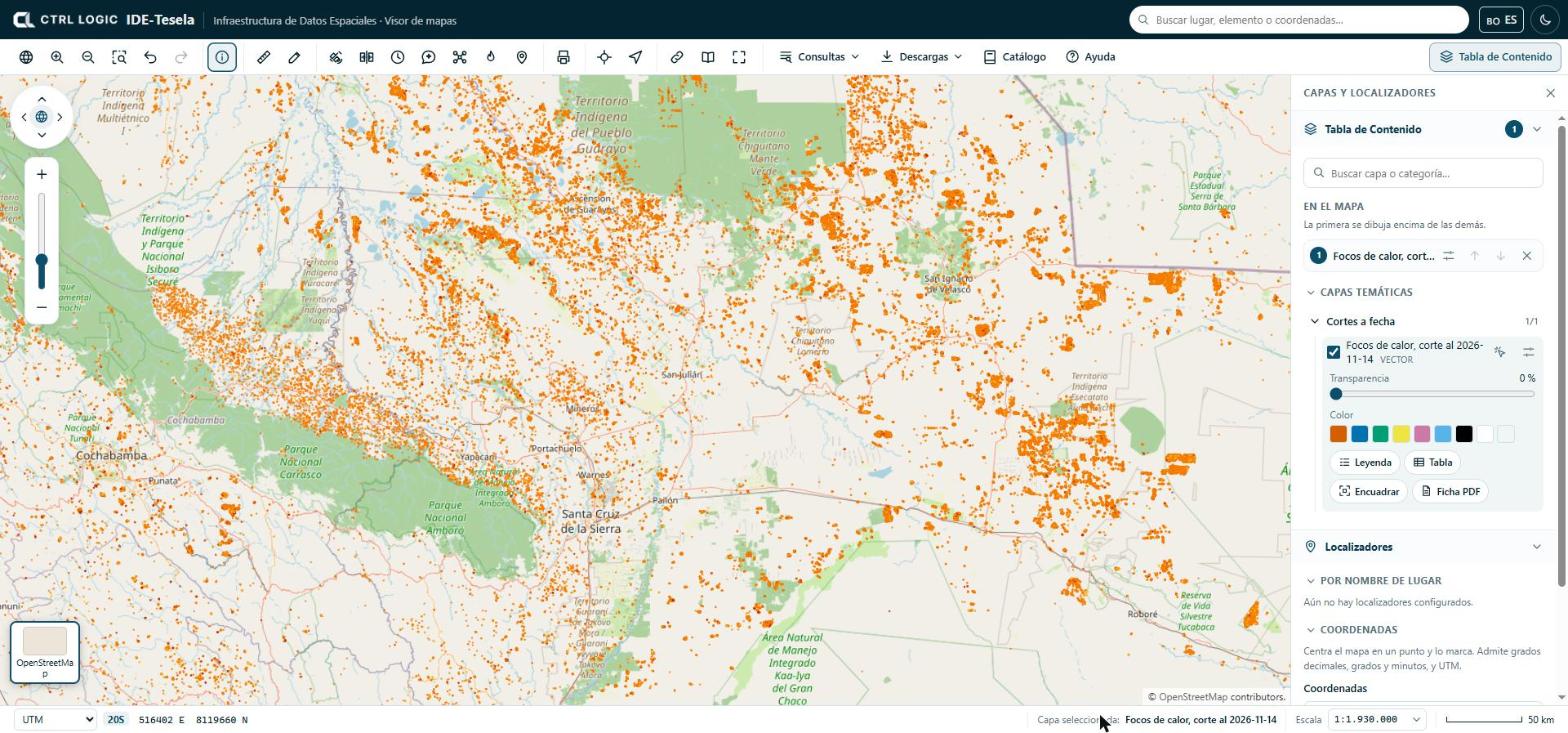
- Transparency: from 0% (opaque) upward, to see what lies underneath.
- Color: changes the color of a vector layer. “Back to the official style” restores the original.
- Legend, Table (attribute table), Zoom to extent (takes the map to the extent of the layer) and PDF sheet (the layer’s technical sheet).
- The “Queryable” icon makes a click on the map query only that layer. Its name appears at the bottom, in “Selected layer”. Click it again to query all the layers that are switched on.
The Table of Contents also lists any local files you open (see chapter 3), your drawings under “My drawings” and, if your institution has enabled them, the “Third-party layers” (chapter 4).
Base map
The thumbnails in the lower left corner let you change the map background. Click the active thumbnail to expand the list:
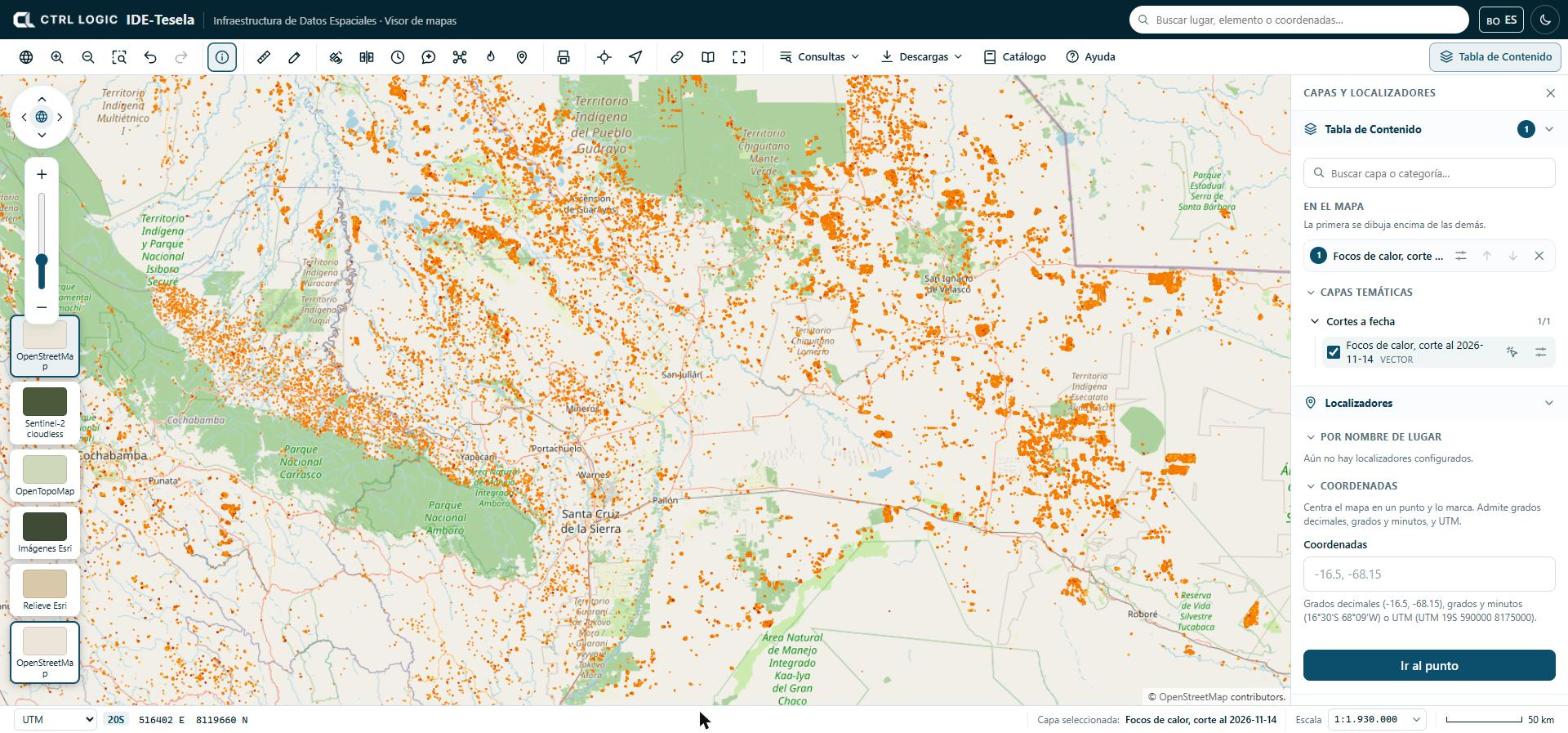
The base map is only the background: it is not part of the analyses. It is cited in the map attribution and in the PDFs you print.
Searching for a place or coordinates
There are three ways to go to a location:
- Header search box (“Search places, features or coordinates”): finds features in layers that have search fields configured, catalog layers and coordinates. If no layer has such fields, the search box tells you so and still accepts coordinates or the name of a layer.
- “Locators” panel, below the layer list. “By place name” offers chained lists (for example department and then municipality) if the administrator configured them. “Coordinates” centers the map on a point and marks it.
- “Go to…” button on the toolbar, which opens the same coordinates box.
Coordinates can be entered in three formats: decimal degrees (-16.5, -68.15), degrees and minutes (16°30'S 68°09'W) or UTM (UTM 19S 590000 8175000). The system tells you how it understood what you typed. If the point falls outside Bolivia, it warns you in case a sign is wrong: in Bolivia the latitude is south and the longitude is west.
- Open “Locators” in the panel or click “Go to…”.
- Type the coordinates in the box.
- Click “Go to point”.
“My location” uses your device’s GPS; it works only over a secure connection (https) and if you grant permission to the browser.
Status bar: coordinates and scale
The bottom bar shows three items:
- Coordinate system: choose between “Decimal geo.”, “DMS geo.” (degrees, minutes and seconds) and “UTM” (with its zone). The coordinates you see correspond to the cursor position.
- Selected layer: which layer is queried when you click.
- Scale: you can type a scale (for example
1:25,000,25000or25k) and press Enter, or choose one from the list. Next to it is the graphic scale bar.
Summary
- The toolbar groups navigation, query, measurement, monitoring, printing and menus; what you see depends on your profile.
- Layers are switched on in the Table of Contents and ordered under “On the map”; the first one is drawn on top.
- The base map is changed with the thumbnails in the lower left corner.
- To go to a place, use the search box, “Locators” or “Go to…”.
- The status bar shows coordinates, the selected layer and the scale.
Chapter 3
Viewer tools
This chapter describes the general-purpose tools of the viewer: identifying what lies at a point, measuring, drawing, querying data, downloading, printing, sharing a view and consulting sources and help. Monitoring analyses, hotspots and historical imagery are explained in chapters 5 to 8.
Only one panel tool is active at a time. The Esc key closes the open panel or menu.
Identify
“Identify” is active by default: when you click on the map, the viewer shows the data of whatever lies at that point.
- Switch on one or more layers in the Table of Contents.
- Click on a feature on the map. The layers that are switched on are queried, from top to bottom.
- Read the attribute card. The “View details” button opens the feature detail, with actions such as “Zoom to extent”, “Copy link”, “Area of influence” and, when the feature is a polygon, “Detect changes here”.
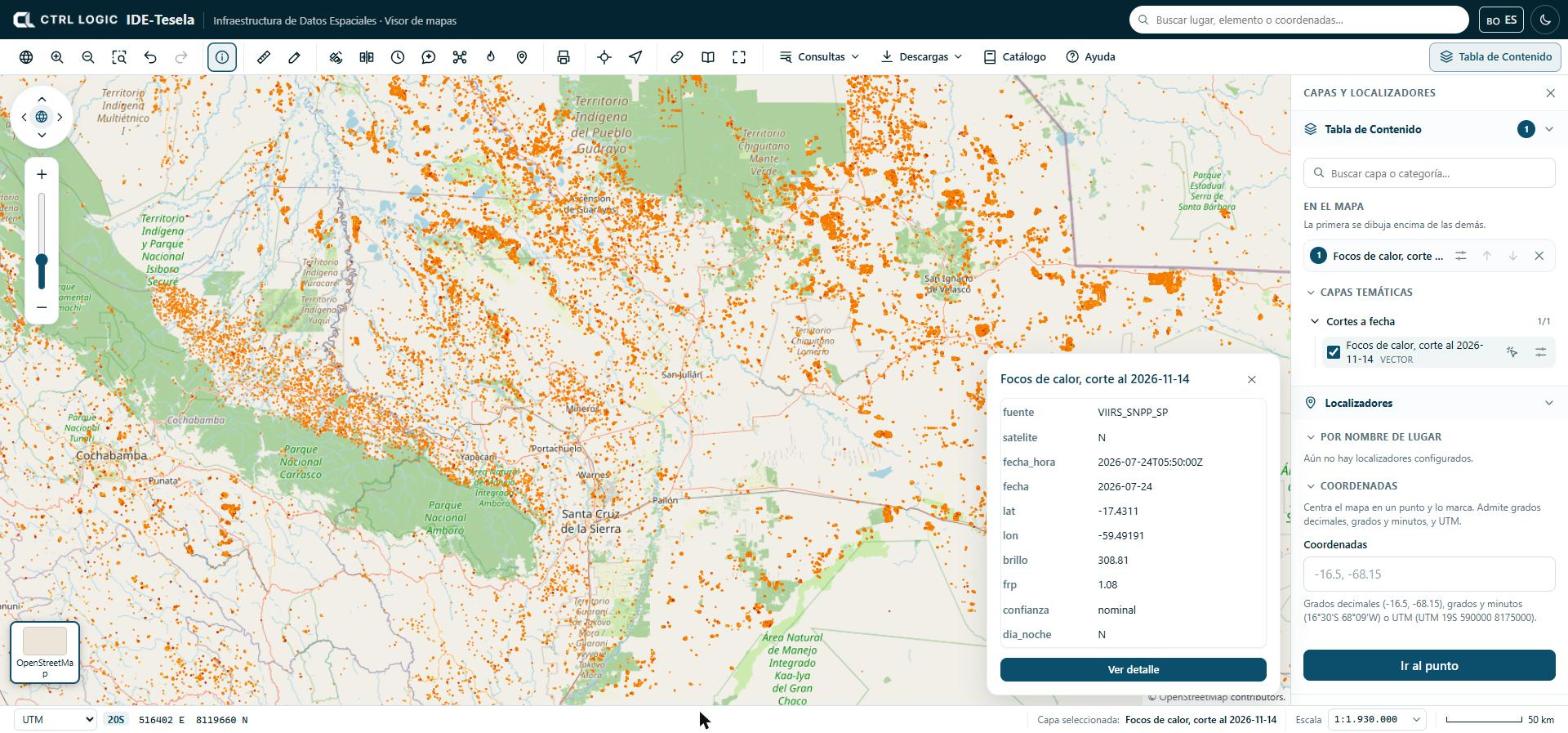
If several layers are switched on and you are interested in only one, click that layer’s “Queryable” icon in the Table of Contents.
Measure
The “Measure” tool calculates distances and areas on the Earth’s surface, not on the flat map.
- Click “Measure” and choose “Distance” or “Area” in the panel.
- Click on the map to mark each point. For an area you need at least three vertices.
- Double-click to finish. The Backspace key removes the last point.
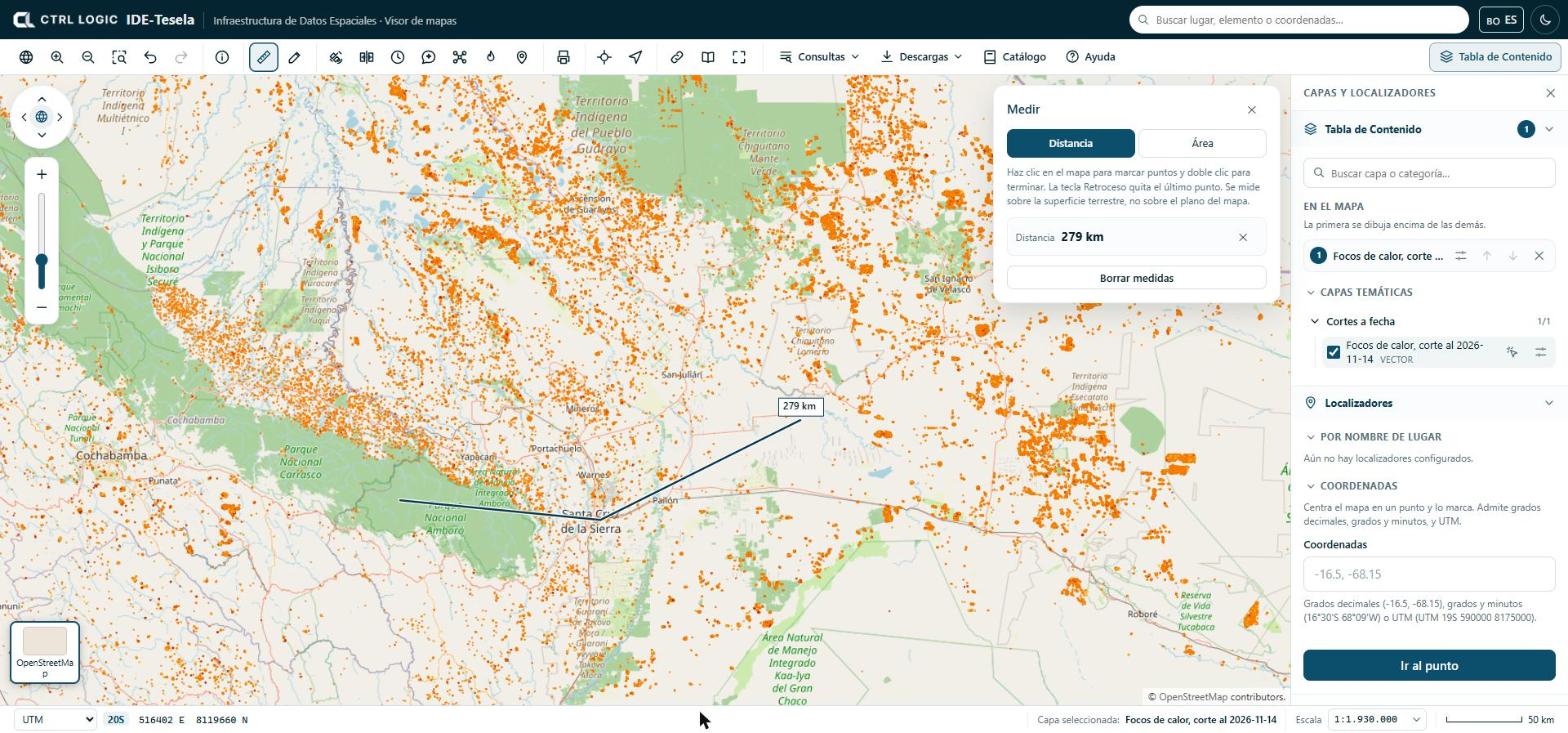
For area measurements the panel also offers the perimeter, the centroid and the “Vertices” table, with the “Copy coordinates” button to paste them into a spreadsheet or a report.
Draw and annotate
“Draw” is used to mark features on the map while you work. The types are “Point”, “Line”, “Area”, “Circle” and “Text”; “Edit” lets you move vertices or entire drawings.
- Click “Draw” and choose the type. The panel explains how each one is drawn (for example, click on each vertex and double-click to finish).
- Choose the color and, depending on the type, the line width or the text size. For a text, type it in the panel and click where you want to place it.
- Review your drawings in the panel list or under “My drawings” in the Table of Contents. To delete them all, click “Delete all” and confirm.
Drawings are saved only in your browser and appear in printouts. They do not travel in the link you share and other people cannot see them.
Area drawings also serve as an input zone for “Monitoring” (chapter 5).
“Queries” menu
The “Queries” menu groups the queries on the data:
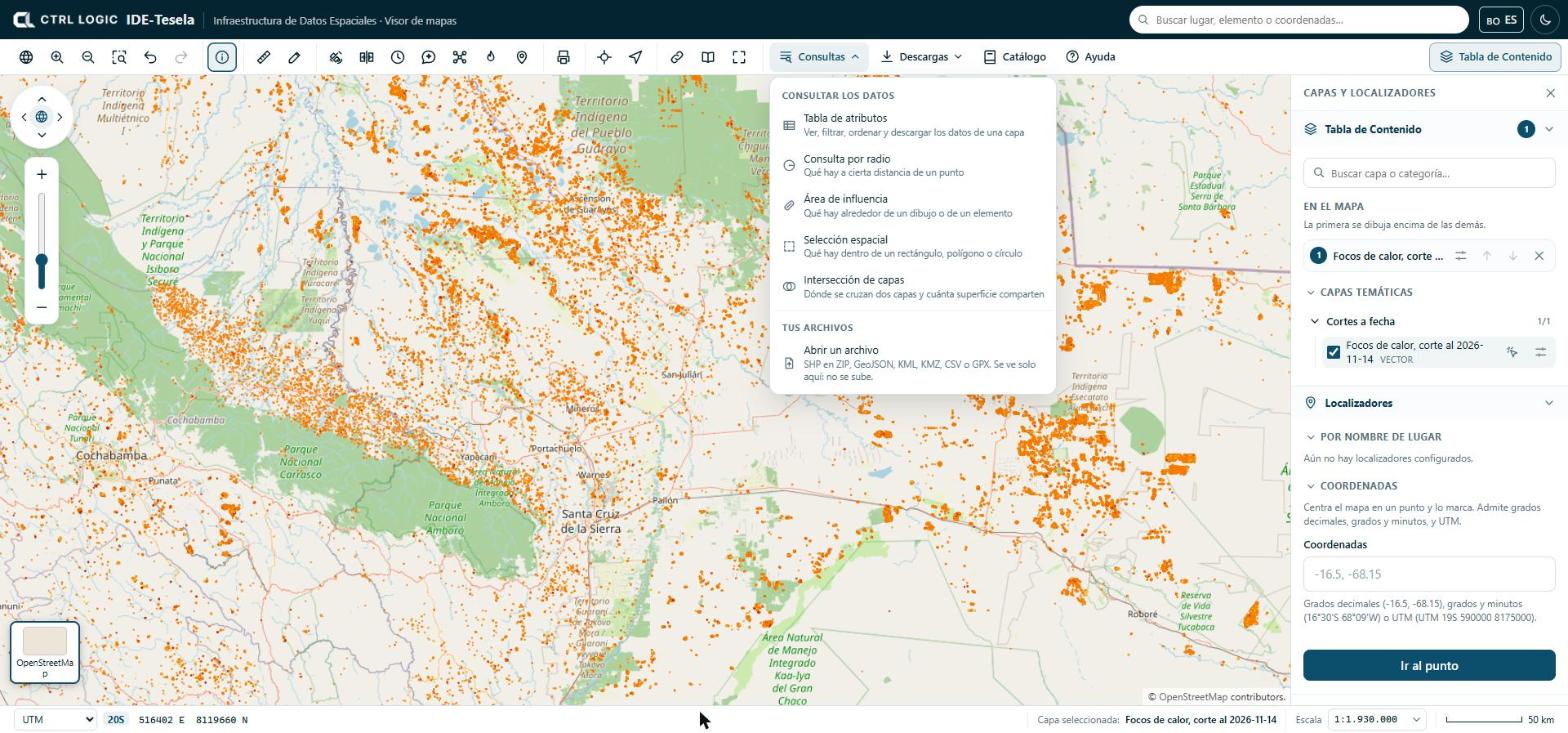
- Attribute table: view, filter, sort and download a layer’s data.
- Radius query: what lies within a given distance of a point.
- Area of influence: what lies around a drawing or a feature.
- Spatial selection: what lies inside a rectangle, polygon or circle.
- Layer intersection: where two layers overlap and how much area they share.
- Open a file: shows your own file on the map (zipped SHP, GeoJSON, KML, KMZ, CSV or GPX). You can also drag it onto the map.
Your own files are read in your browser: they are not uploaded anywhere and only you can see them. A maximum of five can be open at the same time. If a CSV has no recognizable coordinate columns, the viewer asks you which ones they are and which coordinate system they use.
“Downloads” menu
“Downloads” acts on the selected layer and on the current map. If no layer is switched on, it tells you so.
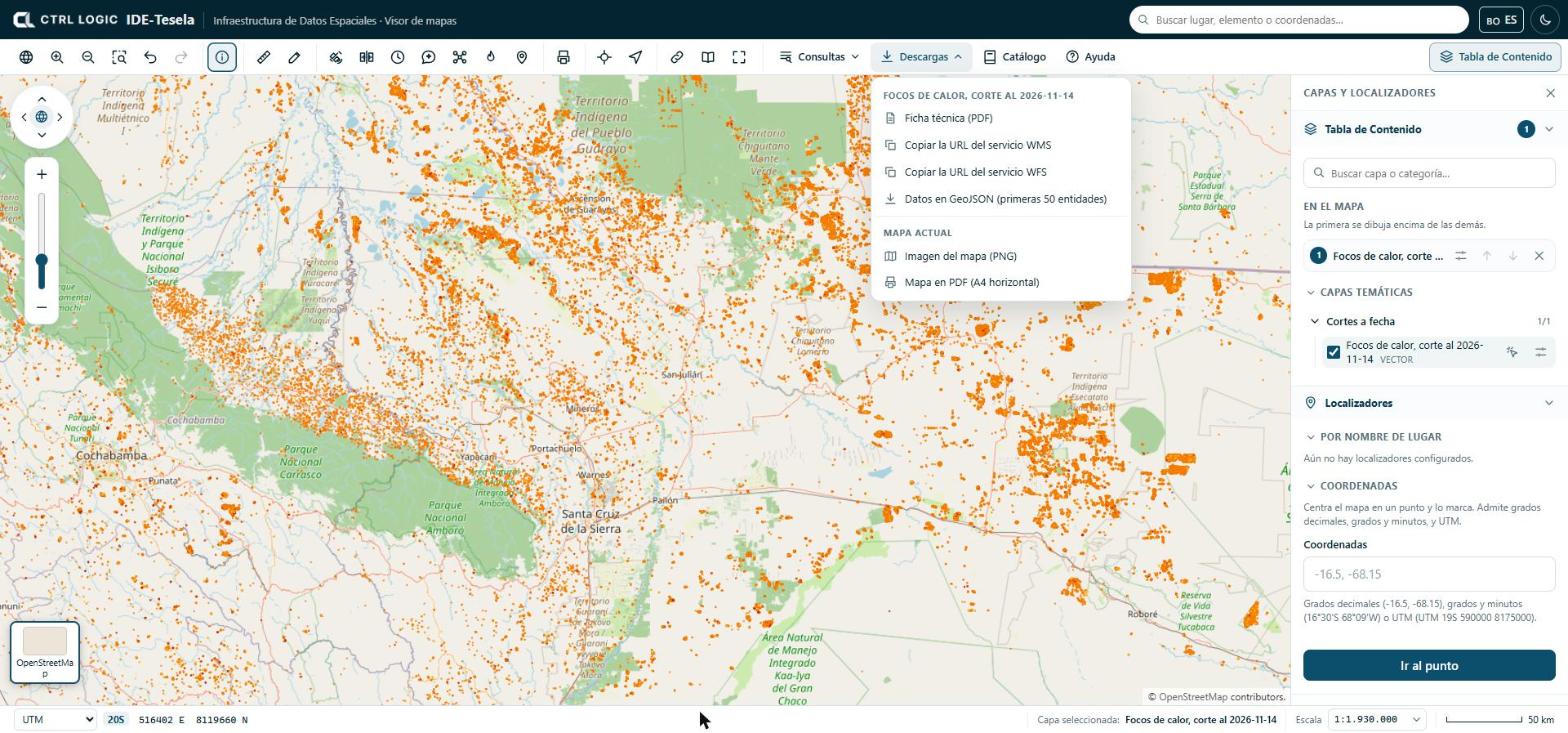
- Layer technical sheet (PDF).
- Copy the WMS service URL and Copy the WFS service URL, to add the layer in QGIS or another GIS program.
- Data as GeoJSON, limited to the first features of the layer (the menu shows the number).
- Map image (PNG) and Map as PDF (A4 landscape), of what you see on screen.
Downloads are recorded in the system audit trail.
Print or export
The “Print” tool prepares a map in document format.
- Click “Print” and enter the “Map title”.
- Choose the paper (A4 or A3) and the orientation (Landscape or Portrait).
- Tick “Include the legend of the active layers” if you want it.
- Click “Download PDF”, or “PNG image” / “JPG image” for a capture of the map as it appears.
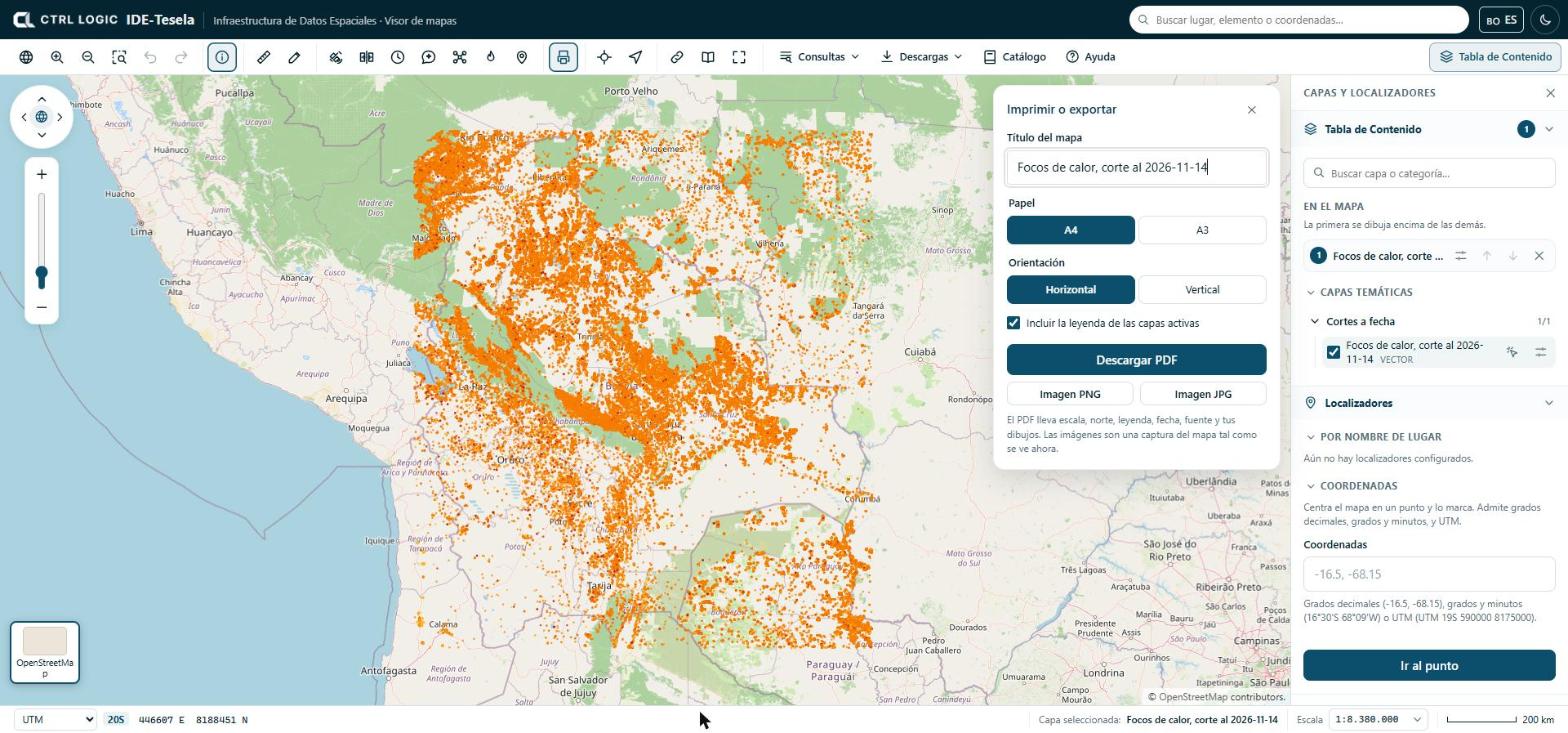
The PDF is a reference document. It does not replace official cartography and has no validity for legal procedures. If a layer takes too long to load, the PDF may come out incomplete and the system warns you.
Share this view
“Share” generates a link that opens the viewer with the same extent, the same base map and the same layers, in the same order and with the same opacity. Click “Copy link” and paste it into an email or a report. Your drawings do not travel in the link.
Full screen, sources and help
- Full screen enlarges the viewer; if the browser does not allow it, try the F11 key.
- Sources opens the “Sources and licenses” panel: origin, license, attribution, version and download date of the third-party data used by Tesela. When you reuse a dataset, cite the source as indicated.
- Help opens “How to use the viewer”, a short guide to movement, layers, queries, scale and keyboard shortcuts.
Summary
- “Identify” shows the attributes of whatever lies where you click.
- “Measure” calculates on the Earth’s surface; “Draw” annotates the map and saves drawings only in your browser.
- “Queries” offers the attribute table, spatial queries and your own files, which are not uploaded.
- “Downloads” and “Print” produce sheets, services, images and PDFs; “Share” copies a link to the current view.
- “Sources” and “Help” are always at hand on the toolbar.
Chapter 4
Third-party layers
In addition to the catalog’s own layers, the viewer can display layers from other institutions that publish their maps as web services. They are called “Third-party layers”. They provide context for a finding (relief, boundaries, protected areas, land cover) without loading that data into Tesela. This chapter explains how they look, where they come from and why some appear only when you are signed in.
Own layers and third-party layers
The institution’s own layers (for example municipalities or protected areas) live in the catalog, are organized into thematic groups such as “Territorial reference”, and can be queried, downloaded and cross-referenced with the analyses.
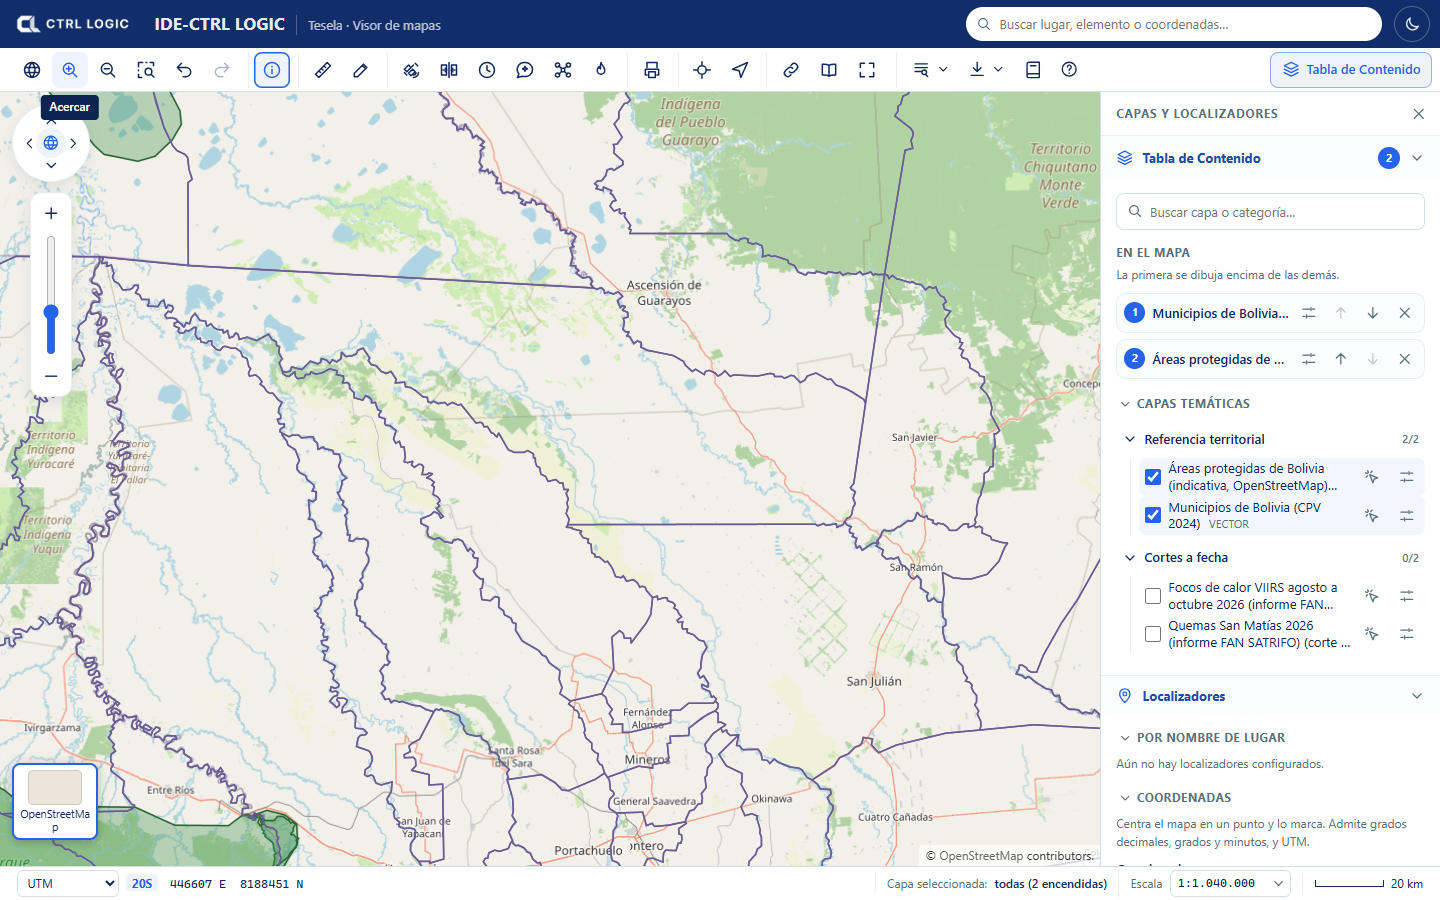
Third-party layers are different: they are not in the Tesela database. Another institution publishes them and Tesela only displays them.
How they work
- They are external, read-only WMS services. An administrator registers them under “Settings → External services” and chooses which of their layers are offered in the viewer.
- The browser never connects to the external service. The map images are requested from the Tesela API, which queries the service from the server and forwards only images. For this reason the services’ addresses and credentials are not exposed.
- Tesela does not validate this data and is not responsible for how current it is. It depends on the source service being available.
How they appear in the viewer
The Table of Contents shows the “Third-party layers” group, with a counter of layers that are switched on. Inside the group:
- A notice reminds you that the data belongs to other institutions, that Tesela only displays it, that it does not validate it or answer for how current it is, and that it depends on the source service.
- Each service is shown with its name, its type (for example WMS) and the line “Source: …” naming the owning institution. If the service has a usage warning, it is shown below.
- Each layer carries the “Third party” label. If it is visible only to signed-in users, it also carries the “Internal” label.
- When you switch a layer on, an “Opacity” control appears and, if the provider published one, a link to the “Provider record”.
- At the foot of the group, the sources of the layers that are switched on are cited (“Data from: …”). Cite them if you reuse the data.
Which services exist and why some are internal
Each service is either public (visible without signing in) or internal (only when signed in). A service is always created as internal, and an administrator makes it public only when sure that its license allows it. A service with a credential can never be public.
The services already registered in this installation are:
| Visibility | Service | What it offers |
|---|---|---|
| Public | NASA GIBS | Relief and bathymetry |
| Public | IGN Argentina | Provinces, departments and protected areas |
| Public | INPE Brazil (PRODES) | Amazon biome and accumulated deforestation |
| Internal | terrestris | Topographic map based on OpenStreetMap |
| Internal | SERNANP Peru | Layers published by Peru’s protected natural areas service |
| Internal | IGM Ecuador | Layers published by Ecuador’s Military Geographic Institute |
| Internal | EOX Sentinel-2 | Sentinel-2 mosaic |
| Internal | GEBCO | Global bathymetry |
A service remains internal when its license has not yet been verified, when its use is non-commercial only or when it does not expressly authorize public browsing. In the meantime, only signed-in people can see it. This protects the institution from reusing data outside its owner’s conditions.
Bolivian data from the INE and GeoBolivia is still pending an agreement and is not available in the viewer.
How an administrator registers a service
This step belongs to administration (chapter 15) and requires a specific permission. It is summarized here so that you know where the layers come from.
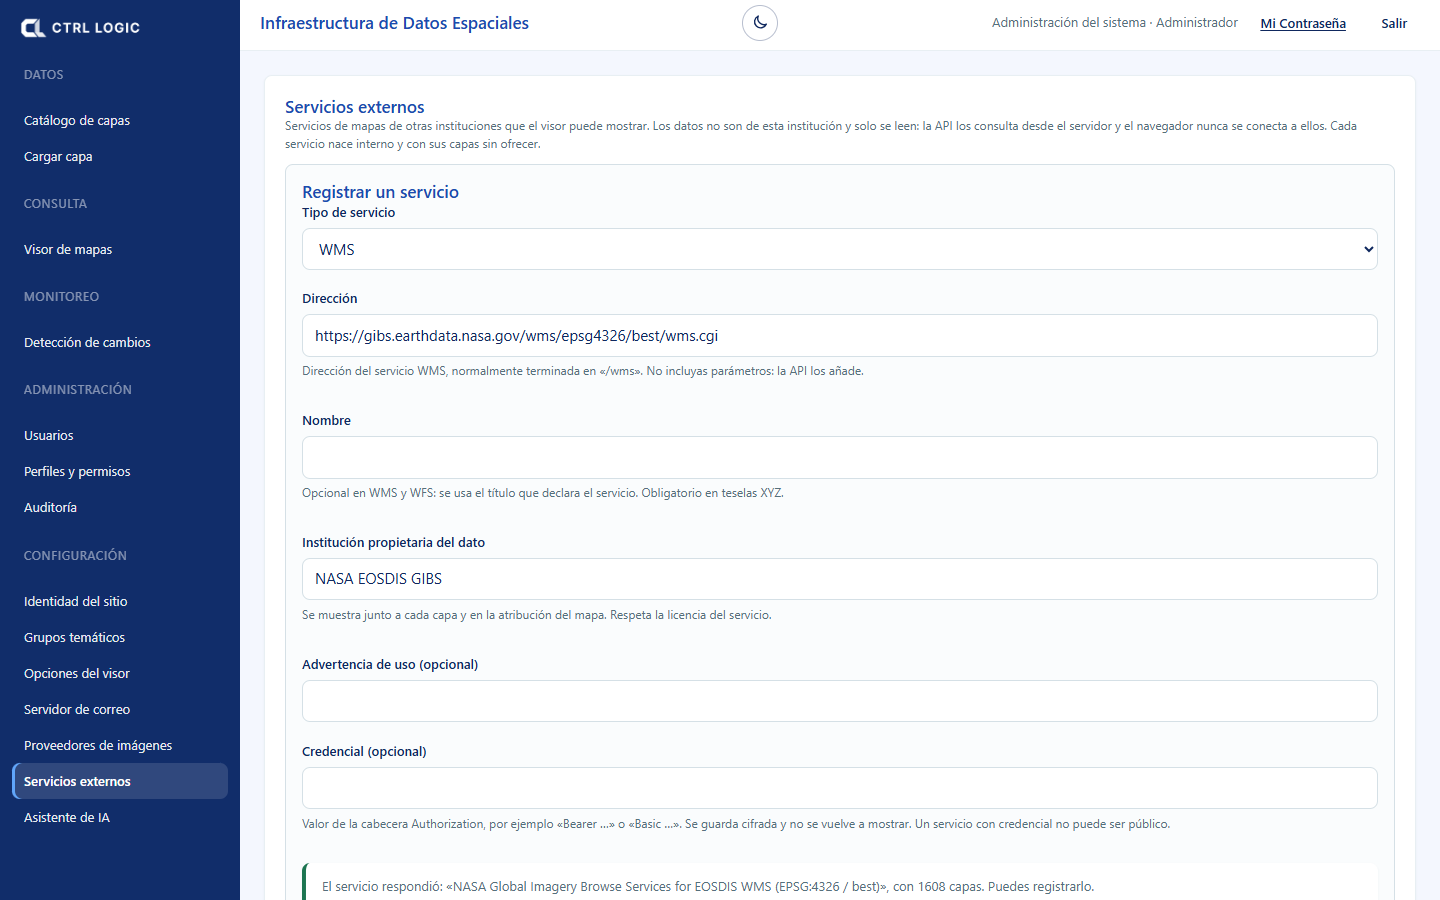
- Go to “Settings → External services”.
- Choose the service type, enter the address (without parameters: the API adds them) and the “Institution that owns the data”.
- Click “Test connection” to see the layers it publishes and then “Register service”.
- Choose which of its layers are offered in the viewer.
- Decide whether the service is public or internal (“Make public” asks for confirmation).
Limits
- Third-party layers have no “Identify” (their attributes are not queried when you click) and no legend inside the viewer. To understand their colors, consult the provider record.
- They are context imagery: they are not part of the cross-references in Tesela’s analyses, which use the catalog’s reference layers.
- If the source service does not respond, the layer is not drawn.
A third-party layer is a visual reference, not a Tesela result. Any coincidence with a finding requires verification with the institution that publishes the data.
Summary
- “Third-party layers” are read-only WMS services from other institutions.
- The browser never calls the external service: everything goes through the Tesela API.
- Each layer shows its source and the notice that the data does not belong to the institution.
- Internal services are visible only when signed in, because the license is unverified, the use is non-commercial or public browsing is not authorized.
- There is no attribute identification or legend in the viewer.
Chapter 5
Change detection
Change detection compares the state of an area in two different periods and delineates the polygons where the terrain changed according to criteria that you set. It uses Sentinel-2 imagery and mathematical calculations (indices and thresholds); it does not use artificial intelligence. The result is indications that require verification, never a determination about their cause or legality.
There are two entry points: the “Monitoring” tool in the viewer (“Changes” and “Burns” tabs) and the “Change detection” page in the side menu, “Monitoring” group. Both request the analysis from the same engine. Burns are covered in chapter 6.
Requesting an analysis from the viewer
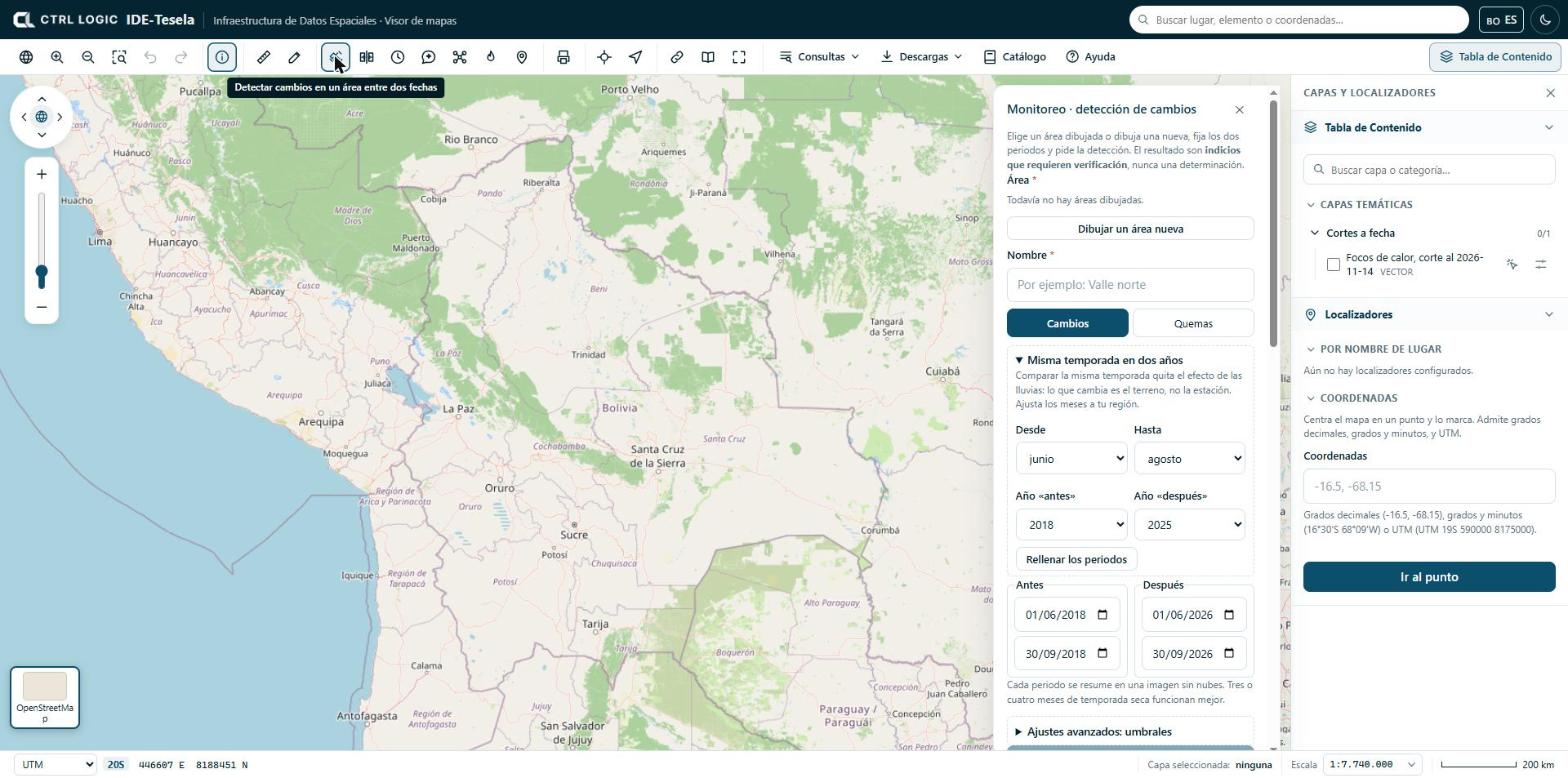
- Click “Monitoring” on the toolbar. The “Monitoring · change detection” panel opens.
- Define the area. You can choose an area you have already drawn, a polygon selected through “Identify → Detect changes here”, or click “Draw a new area”: click on the map for each vertex and double-click to close.
- Enter a name so that you can recognize the analysis later.
- Leave the “Changes” tab active (the “Burns” tab is covered in chapter 6).
- Set the “Before” and “After” periods (see below).
- If necessary, adjust the thresholds under “Advanced settings: thresholds”.
- Click “Detect changes”. The job is queued and takes a few minutes.
Periods and “Same season in two years”
Each period (start and end) is summarized in a single cloud-free image, calculated as the median of the available scenes. Three or four months of dry season work best; with less, there may be no clean image.
Comparing any two dates mixes real change with the effect of the rains. The “Same season in two years” block avoids this: you choose the months (“From” and “To”), the “Year before” and the “Year after”, and click “Fill in the periods”. The initial months are June to August; adjust them to your region. If the season has not started yet in one of the years, the panel asks you to choose an earlier year.
If your institution has more than one imagery provider configured, the “Imagery from” selector appears.
Advanced thresholds
A polygon counts as a change when the “after − before” difference meets all the conditions that are ticked. The initial values are:
| Index | What it measures | Initial condition |
|---|---|---|
| NDVI | Vegetation vigor | Active: drops by at least 0.2 |
| BSI | Bare soil | Inactive: rises by at least 0.1 |
| NBR | Burning and vegetation moisture | Inactive: drops by at least 0.15 |
| NDWI | Surface water | Inactive: rises by at least 0.15 |
Where there is vegetation, a drop in NDVI is enough. In areas without vegetation (highlands, desert) it is better to use bare soil (BSI rises) or NBR (drops). The “Minimum patch (ha)” is also set, which discards smaller polygons; the initial value is 0.5 ha.
Following your analyses
Below the form, “My analyses” appears. Each card shows the status (Queued, Processing, Completed, Failed or Cancelled), the number of polygons and the hectares with indications, or “No changes” when no polygon met the rule. You can search by name and filter by status. A failed analysis can be retried (“Retry”) and a queued one can be cancelled (“Cancel”).
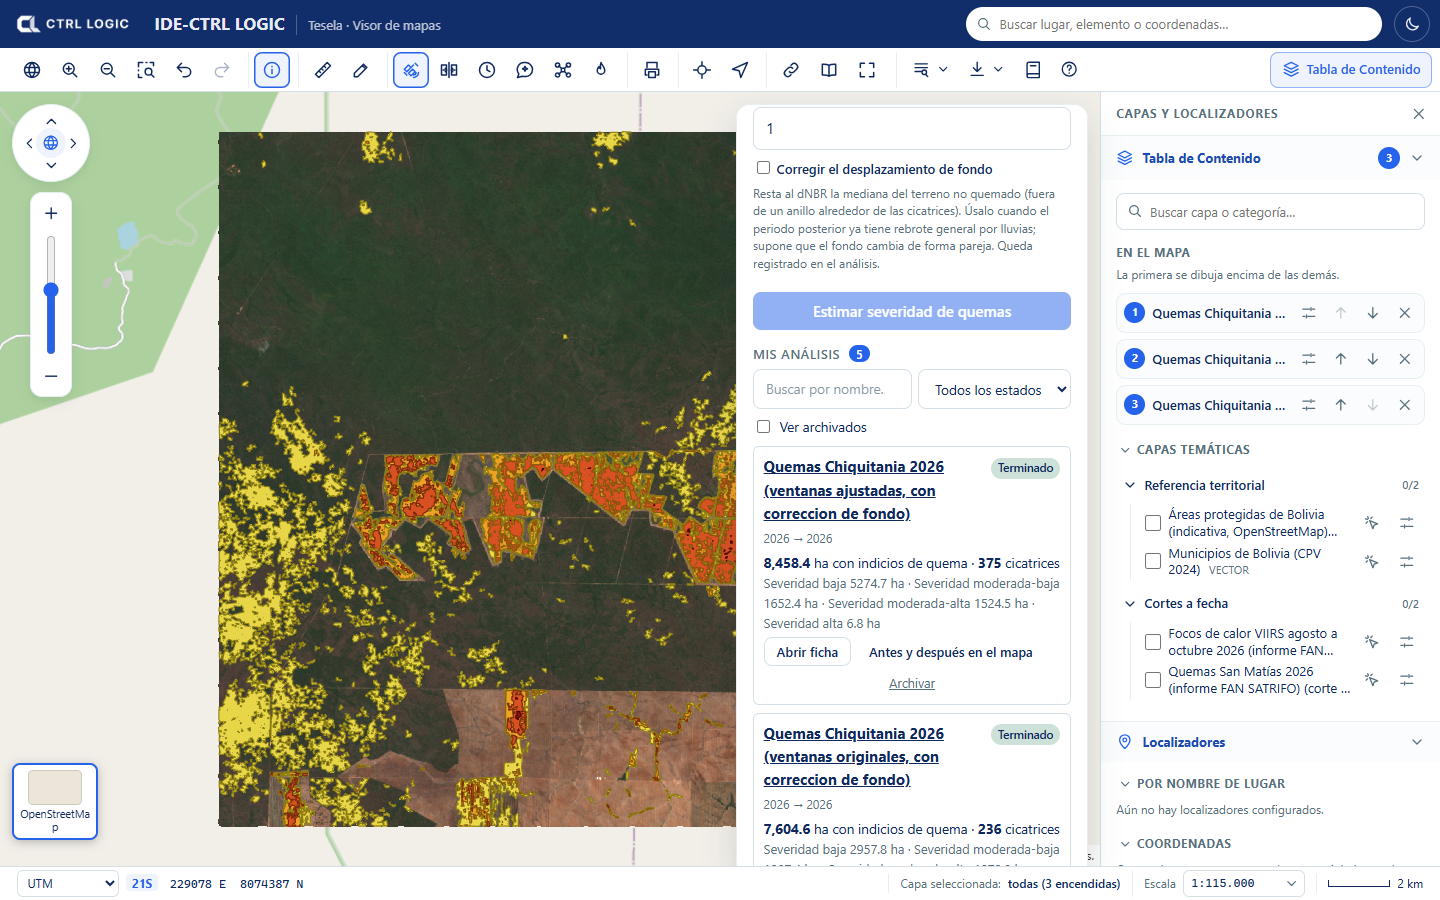
The analysis sheet
“Open sheet” shows the whole analysis in a window:
- At the top, the “before” period against the “after” period, with a swipe handle that you drag to compare, and the label “indications that require verification”.
- Visualization tabs to see the same scene in different ways (see below) and an “Indications” checkbox that draws the polygons on top.
- Figures: number of polygons, hectares with indications and hectares analyzed, broken down by type of change.
- “Polygons by area”: a table with the number, type, hectares and NDVI variation of each zone.
- “Traceability”: periods, rule used, minimum patch, creation date, duration and source of the imagery.
The types of change that can be assigned are “Vegetation loss”, “Exposed soil”, “New water” and “Unclassified”. They are descriptive categories of the type of alteration, not assessments of its origin.
From the sheet you can click:
- “Before and after on the map”: opens the viewer’s comparison tool with the two dates already loaded (chapter 8).
- “Only indications on the map”: switches on only the polygons.
- “Evidence sheet (PDF)”: generates a PDF with the images, the table of zones, how the result was obtained and the statement “These results require verification”.
Scenes by period
For the “before” and the “after” period, each analysis publishes several scenes that help interpret what was detected:
| Scene | What it is for |
|---|---|
| Natural color | What the eye would see |
| False color | Highlights healthy vegetation in bright red |
| SWIR | Shows soil and moisture; bare soil stands out |
| NDVI | Vegetation vigor |
| NDWI | Surface water |
| NDSI | Snow and ice |
An urban false color (built-up surfaces and disturbed soil) is also generated. If an analysis ends with “No changes”, the scenes are still available: compare them by eye and, if you see differences, repeat the analysis with other thresholds.
Archiving and deleting
- Archive removes the analysis from the list without deleting it. It stays intact and can be seen by ticking “Show archived”; “Return to the list” brings it back to “My analyses”.
- Delete removes the analysis permanently, with its scenes and its polygons. The system asks “Delete permanently, with its scenes and polygons?”; it is deleted only if you confirm with “Yes, delete”. This cannot be undone. They are available only when the analysis is no longer in progress.
If you only want to tidy your list, use “Archive”. “Delete” is final.
Limits
- Resolution: Sentinel-2 pixels are 10 to 20 m. It detects changes down to fractions of a hectare; it does not see very small interventions or what happens under cover.
- Clouds: in tropical areas or in the rainy season there may be no clean image for weeks. This is mitigated with longer periods or the same season in two years. Radar (Sentinel-1) is planned but not yet available.
- Thresholds: how much an index must vary to count as a change depends on the terrain. Without local calibration, the result may overestimate or underestimate.
- A polygon is an alteration detected between two images: it does not indicate the cause or whether it is legal. It always requires verification.
Summary
- Draw an area, name it, set the “before” and “after” periods (ideally the same season) and click “Detect changes”.
- The initial rule is a drop in NDVI of at least 0.2 with a minimum patch of 0.5 ha; it is adjusted under “Advanced settings”.
- The analysis sheet brings together the comparison, the polygons, the traceability and the scenes by period.
- “Before and after on the map” opens the comparison tool; “Archive” hides; “Delete” removes permanently and asks for confirmation.
- Every result is an indication that requires verification.
Chapter 6
Burns and severity
Burn analysis estimates the severity of areas with indications of burning by comparing a period before and a period after the fire. It uses the dNBR index calculated from Sentinel-2 imagery at 20 m. Like the rest of the detection, it is mathematical and explainable (no artificial intelligence), and its result is an estimate that requires verification: it does not indicate the cause of the burn or its legality.
What dNBR is
The NBR (Normalized Burn Ratio) combines two Sentinel-2 bands: the near infrared (B8A), where healthy vegetation reflects strongly, and the shortwave infrared (B12), which responds to soil and moisture. In a burned area the NBR drops. The dNBR is the difference between the NBR of the earlier period and that of the later period: the higher it is, the greater the alteration of the cover.
The severity classes derive from dNBR thresholds based on the USGS:
| Class | dNBR (initial threshold) |
|---|---|
| Vegetation regrowth | below −0.1 |
| Low severity | from 0.1 |
| Moderate-low severity | from 0.27 |
| Moderate-high severity | from 0.44 |
| High severity | from 0.66 |
These values are set by the burn domain template. The sheet of each analysis shows the thresholds that were used.
How to request it
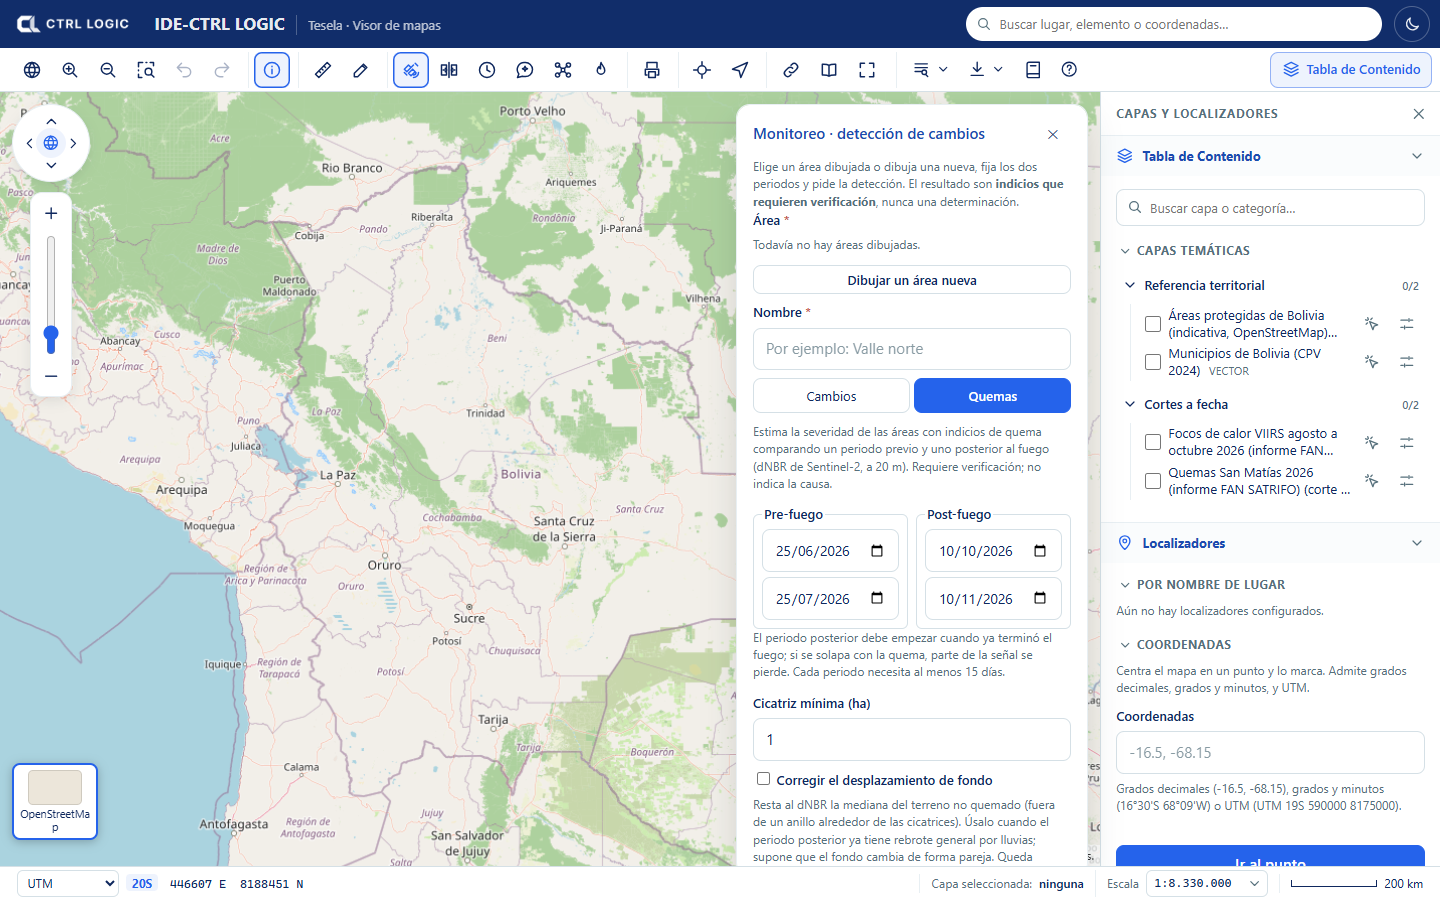
- Open “Monitoring” on the toolbar, choose or draw the area and enter a name (as in chapter 5).
- Click the “Burns” tab.
- Set the Pre-fire period (start and end) and the Post-fire period. The later period must start when the fire has already ended: if it overlaps with the burn, part of the signal is lost. Each period needs at least 15 days.
- Enter the “Minimum scar (ha)”: smaller patches are discarded. The initial value is 1 ha.
- If the later period already shows general regrowth caused by rain, consider ticking “Correct background offset” (see below).
- Click “Estimate burn severity”. The job goes through stages (preparation, composites, indices, vectorization and cross-referencing with municipalities and protected areas) and finishes in a few minutes.
Background correction
Between two dates, vegetation may turn green or dry out across the whole area, not only where there was fire. “Correct background offset” subtracts from the dNBR the median of the unburned terrain (the terrain outside a ring around the scars). It assumes that the background changes uniformly. If there is very little background terrain, or the offset is too large to be a background effect, the correction is not applied and the sheet says so. Whether or not it is applied is recorded in the analysis.
How to read the sheet
When you open the sheet of a burn analysis, the header shows the periods and the “Requires verification” label.
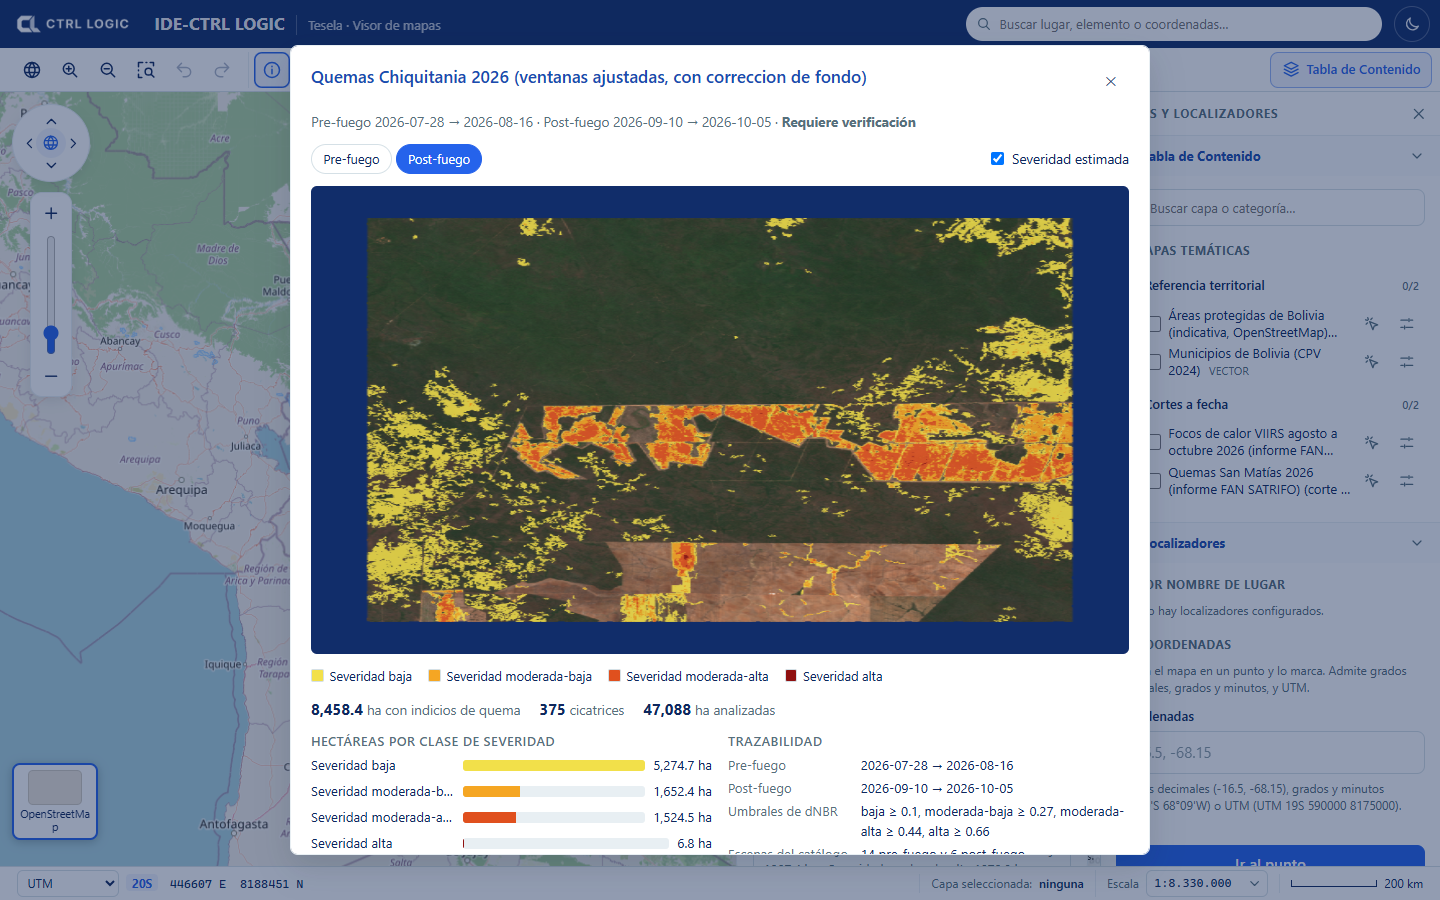
- Image: switches between “Pre-fire” and “Post-fire” (natural color); the “Estimated severity” checkbox overlays the scars colored by class.
- Figures: hectares with indications of burning, number of scars and hectares analyzed.
- Hectares by severity class: how much area falls in each class.
- Traceability: periods, dNBR thresholds used, catalog scenes employed, percentage of no-data pixels, status of the background correction, creation date and imagery source.
- Municipalities and protected areas with the most hectares: cross-reference with the reference layers. Hectares are calculated in an equal-area projection.
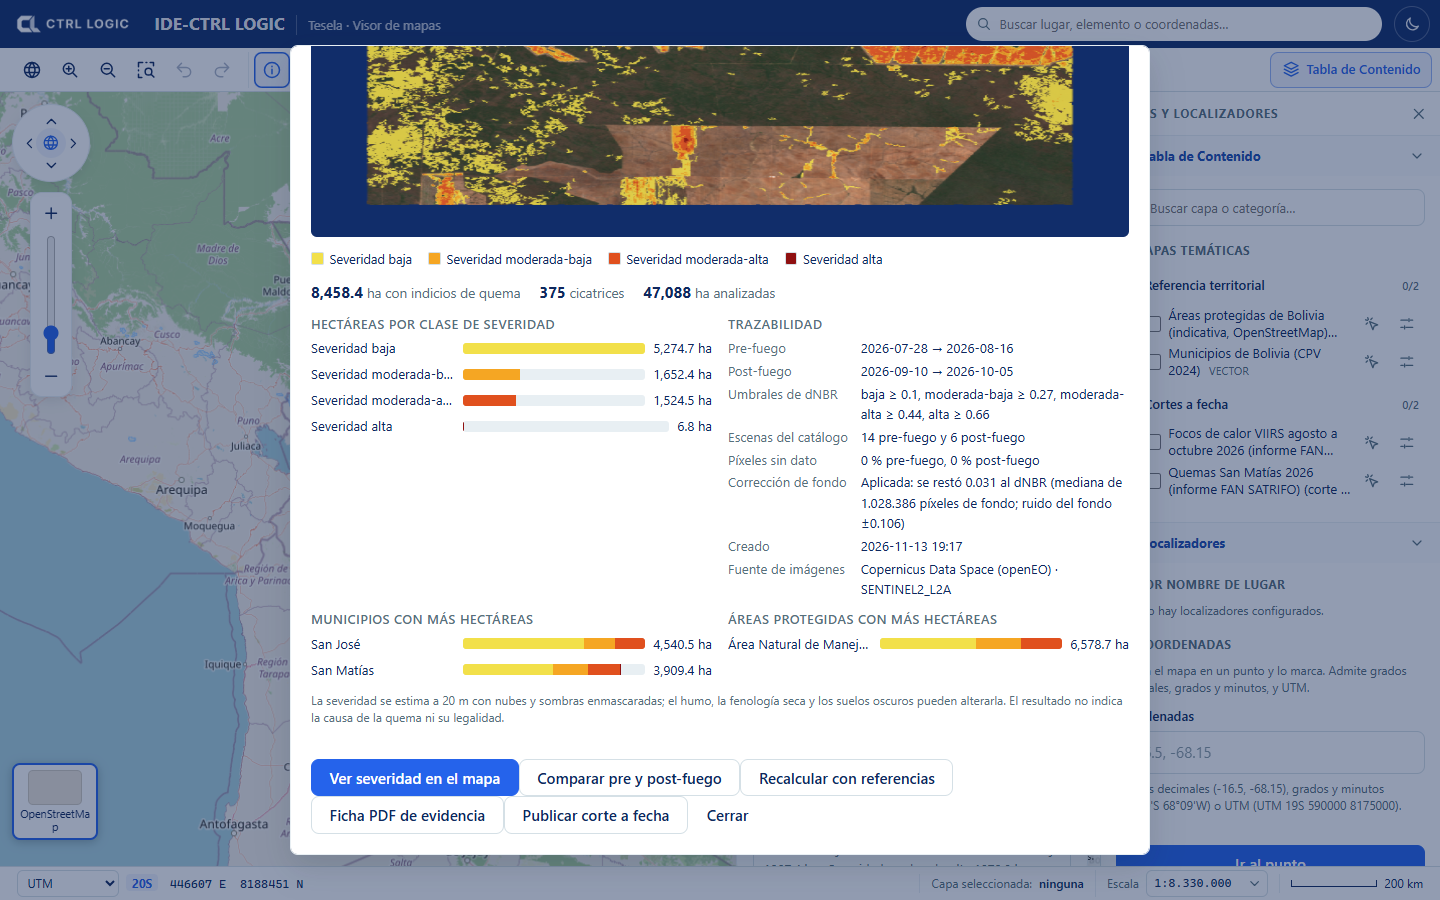
The protected areas in the demonstration come from OpenStreetMap and are indicative: they may omit areas and their boundaries are not the official ones. A spatial coincidence between a scar and an area or a municipality implies no cause or responsibility whatsoever.
Sheet actions
- “View severity on the map”: switches on the severity as a viewer layer.
- “Compare pre and post-fire”: opens the comparison tool with the two images (chapter 8).
- “Recalculate with references”: redoes the cross-references with municipalities and protected areas using the layers loaded now, without downloading imagery again. Useful if those layers were loaded after the analysis.
- “Evidence sheet (PDF)”: generates the PDF with the results and their traceability.
- “Publish snapshot” (depending on permissions): freezes the result as a snapshot (chapter 12).
How to interpret with caution
- The scars are indications of burning. The sheet states expressly that the result does not indicate the cause of the burn or its legality.
- Severity is estimated at 20 m, with clouds and shadows masked. Smoke, dry-season phenology and dark soils can alter it.
- Without calibration against known cases in the region, severity may be underestimated.
- Cross-check with hotspots (chapter 7) and, where it matters, with verification in the field.
Summary
- Burn analysis compares a pre-fire and a post-fire period using Sentinel-2 dNBR at 20 m.
- The result is classified as low, moderate-low, moderate-high and high severity, with hectares per class, per municipality and per protected area.
- The background correction is optional and is recorded.
- The sheet preserves traceability: periods, thresholds, scenes, no-data pixels and source.
- It is an estimate that requires verification; it indicates neither cause nor legality.
Chapter 7
Heat hotspots
The “Hotspots” tool shows the thermal activity detected by satellites, taken from NASA FIRMS (VIIRS sensor). It lets you see how many hotspots occurred in a date range, where they were concentrated and in which municipalities and protected areas they fall. A heat hotspot is thermal activity consistent with burning or other heat sources. It is an indication and requires verification: it does not indicate the cause or the legality.
Opening the panel and choosing the range
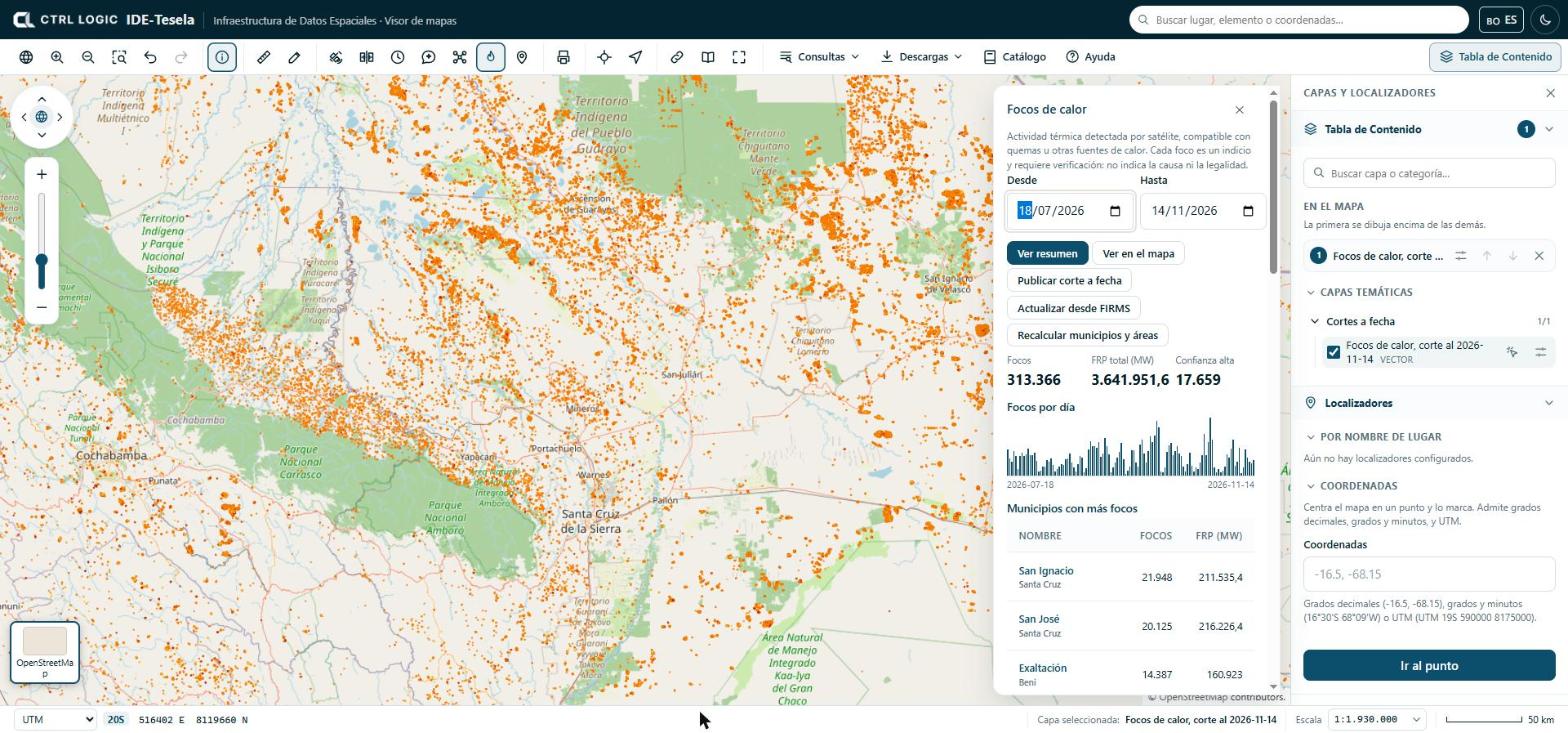
- Click “Hotspots” on the toolbar (“Monitoring” group).
- Choose the “From” and “To” dates. The range cannot exceed one year; if the start date is later than the end date, the panel tells you.
- Click “Show summary” to see the figures for the range.
- Click “Show on the map” to draw the hotspots as a layer. The layer is named “Hotspots · [from] to [to]” and appears under “On the map”.
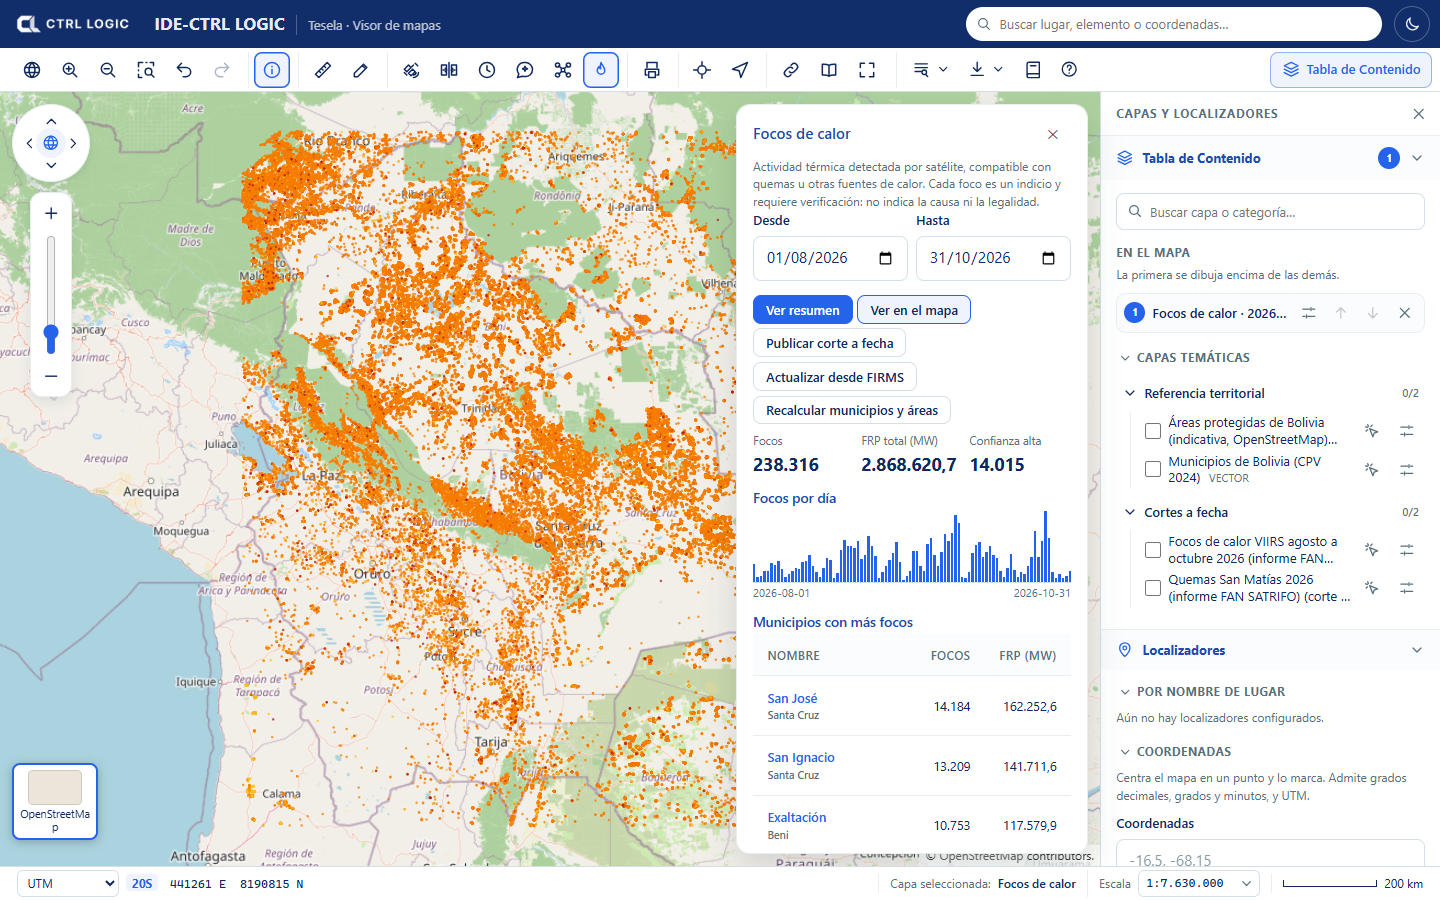
How to read the summary
- Hotspots: number of hotspots in the range.
- Total FRP (MW): sum of the fire radiative power, in megawatts. It measures the energy emitted by the thermal activity, not its size or its cause.
- High confidence: how many hotspots the provider rates with high confidence.
- Hotspots per day: bar chart. When you move the cursor over a bar you see the date and the number of hotspots.
- Municipalities with the most hotspots and Protected areas with the most hotspots: tables with the number of hotspots and the FRP of each unit.
Cross-references with municipalities and protected areas
Each hotspot is cross-referenced with the catalog’s reference layers: it is assigned its municipality and, if it falls inside one, its protected area. The “Municipalities with the most hotspots” and “Protected areas with the most hotspots” tables are sorted from highest to lowest. When you click the name of a unit, the map is filtered to the hotspots of that zone (“Filtered by: …”); “Remove filter” shows them all again.
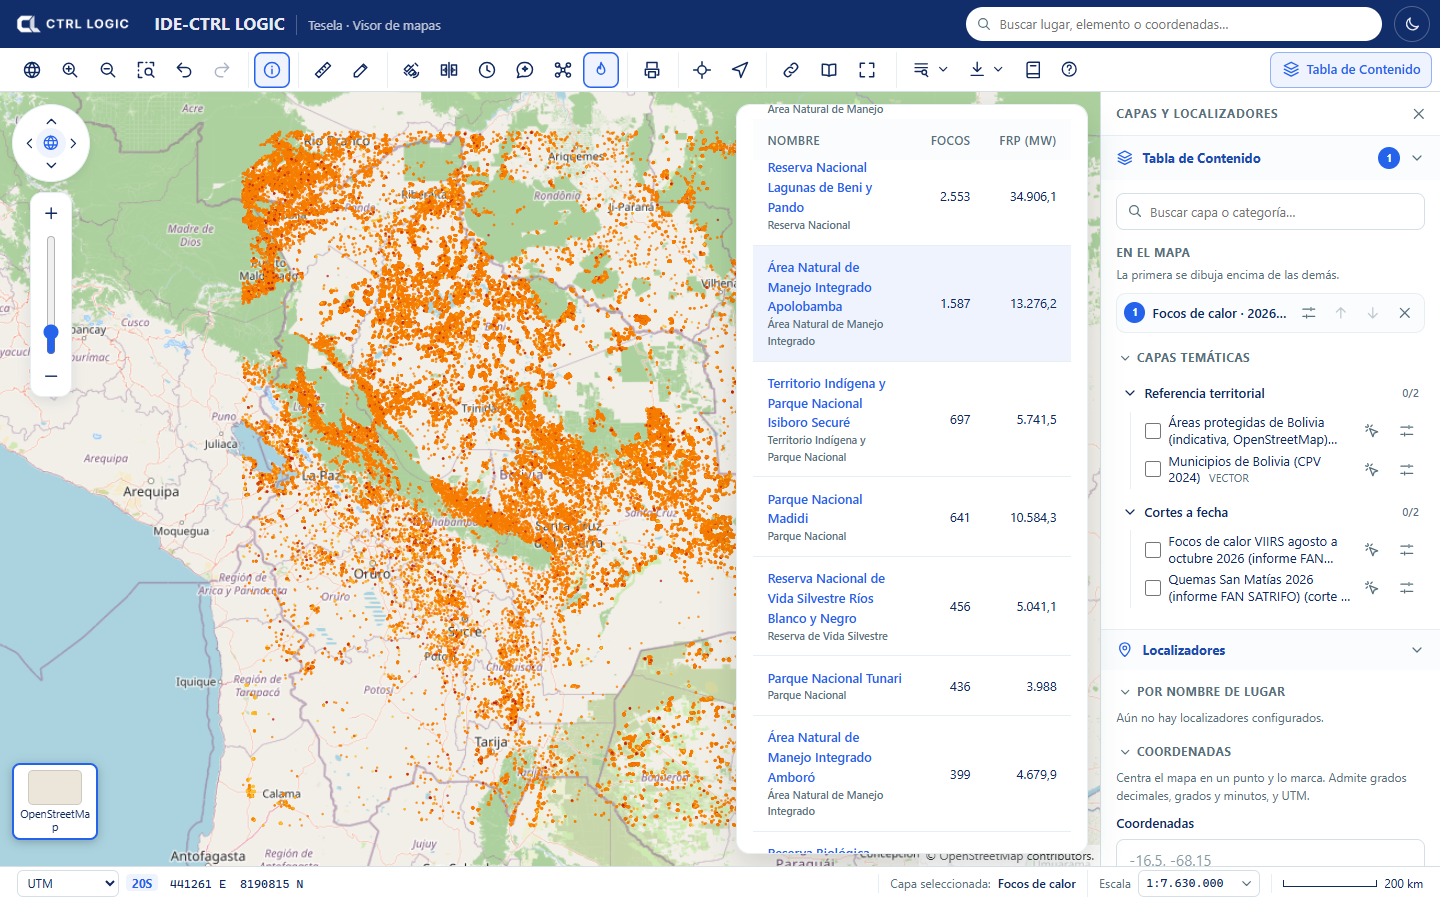
If the cross-reference shows notices, they mean the following:
- “The municipalities layer is not loaded yet”: results cannot be grouped by municipality until it is loaded.
- “No hotspot in the range falls inside a protected area”: this is a valid result.
- “N hotspots fall outside the loaded municipalities”: the municipalities layer does not cover that point.
Data update
Below the figures, the “Data update” block reports the last FIRMS download (date, origin and status), whether an automatic download is scheduled and when the last cross-reference with municipalities and protected areas took place. People with permission can:
- “Update from FIRMS”: requests the download of the hotspots for the range. It is queued and you should query again in a few minutes.
- “Recalculate municipalities and areas”: redoes the cross-reference of each hotspot with the layers loaded now.
- “Publish snapshot”: freezes the state of the hotspots in a new, immutable layer (chapter 12).
If you do not see those buttons, your profile does not have them enabled. If the range has no hotspots loaded, the panel suggests trying other dates or updating from FIRMS.
Cautious reading
A hotspot is a thermal detection, not a confirmation of burning or of its origin. It may correspond to a burn, to another heat source or, at times, to a false detection. It is useful for deciding where to look first and is cross-checked against imagery (chapters 5 and 6) and, where it matters, against field verification.
- Each “Identify” card on a hotspot includes source, satellite, date and time, brightness, FRP, confidence and whether it was day or night.
- A hotspot near or inside a municipality or protected area is a spatial coincidence that requires verification; it attributes facts to no one.
- Hotspots are points of about 375 m resolution: they do not delimit the burned area. The burn analysis is for that.
The source and attribution of the data are: NASA FIRMS (LANCE, EOSDIS), open NASA data. Cite them when you reuse them. The “Sources” panel (chapter 3) shows the license and attribution of published snapshots.
Summary
- “Hotspots” shows the thermal activity from NASA FIRMS (VIIRS) in a date range of up to one year.
- “Show summary” gives the total hotspots, the FRP, high confidence and the per-day series; “Show on the map” draws the layer.
- Hotspots are cross-referenced with municipalities and protected areas and can be filtered by zone.
- Each hotspot is an indication and requires verification; it indicates neither cause nor legality.
Chapter 8
Historical imagery and layer comparison
To put a finding in context, it helps to see the same place at another point in time. The viewer offers two tools with a “swipe” (a vertical line that you drag across the map to reveal one side or the other): “Historical”, which compares the map on two dates, and “Compare”, which compares any two layers. Neither calculates anything new; they only show what already exists.
Historical imagery
“Historical” compares the imagery map in two different versions, based on the Esri Wayback archive. It is used to see how a place looked before and after, for example to contrast with a change analysis.
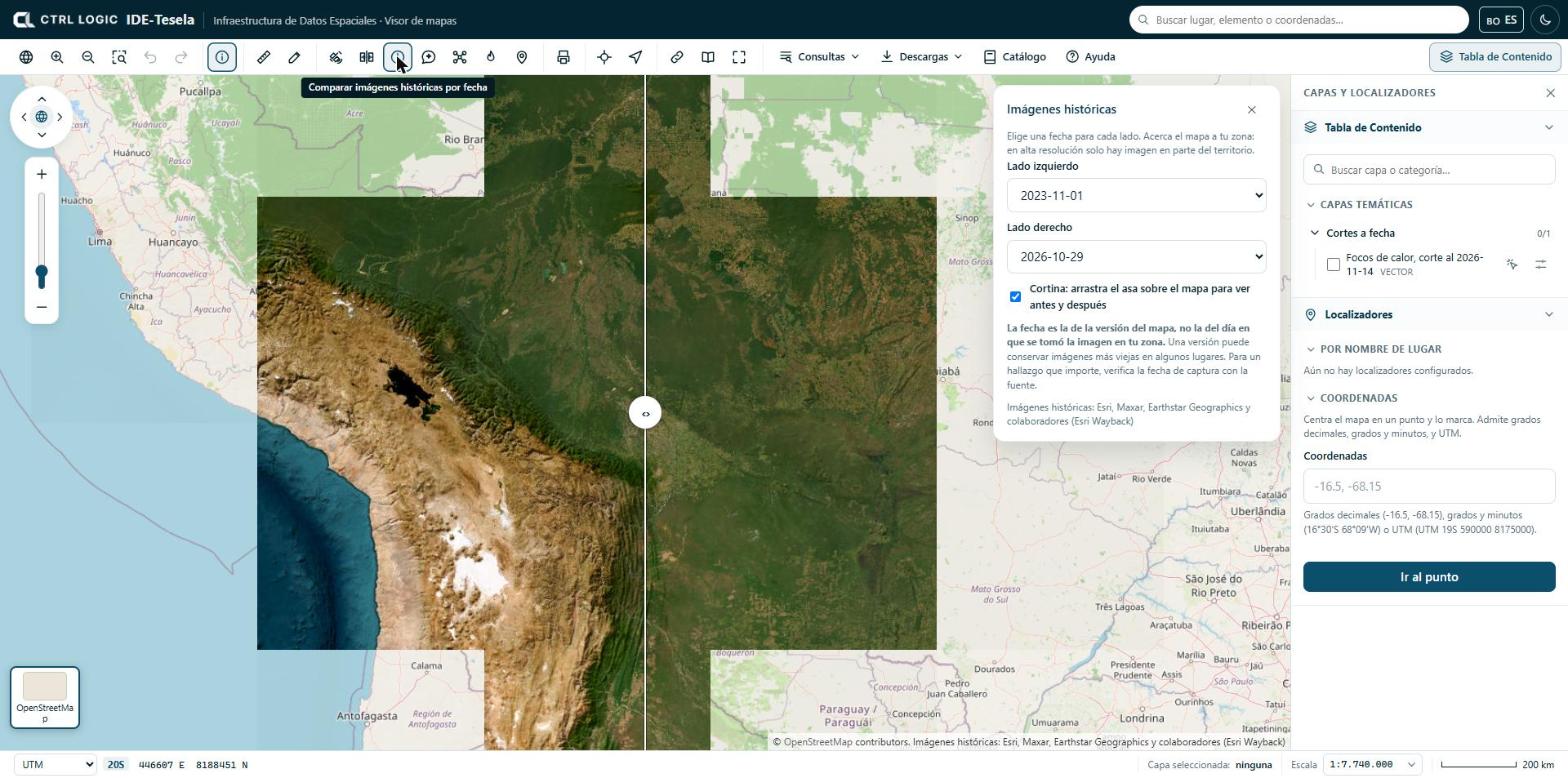
- Zoom the map to your area of interest. At high resolution there is imagery for only part of the territory.
- Click “Historical” on the toolbar.
- Wait for the available dates to load. If this fails, the panel asks you to try again in a few minutes.
- Choose a date for the “Left side” and another for the “Right side”.
- Leave the “Swipe” checkbox ticked and drag the handle (‹ ›) across the map to see the before and the after. You can also move the handle with the keyboard arrow keys when it is focused.
If you untick the swipe, only the date of the right side is shown.
The date is that of the map version, not the day on which the image was taken in your area. A version may retain older images in some places. For a finding that matters, verify the capture date with the source.
The attribution is: Esri, Maxar, Earthstar Geographics and contributors (Esri Wayback). It appears in the map footer while the tool is active.
Comparing two layers with a slider
“Compare” places two layers that are switched on side by side with the same swipe. It is useful, for example, to compare the natural-color image of two periods, or a scene and a reference layer.
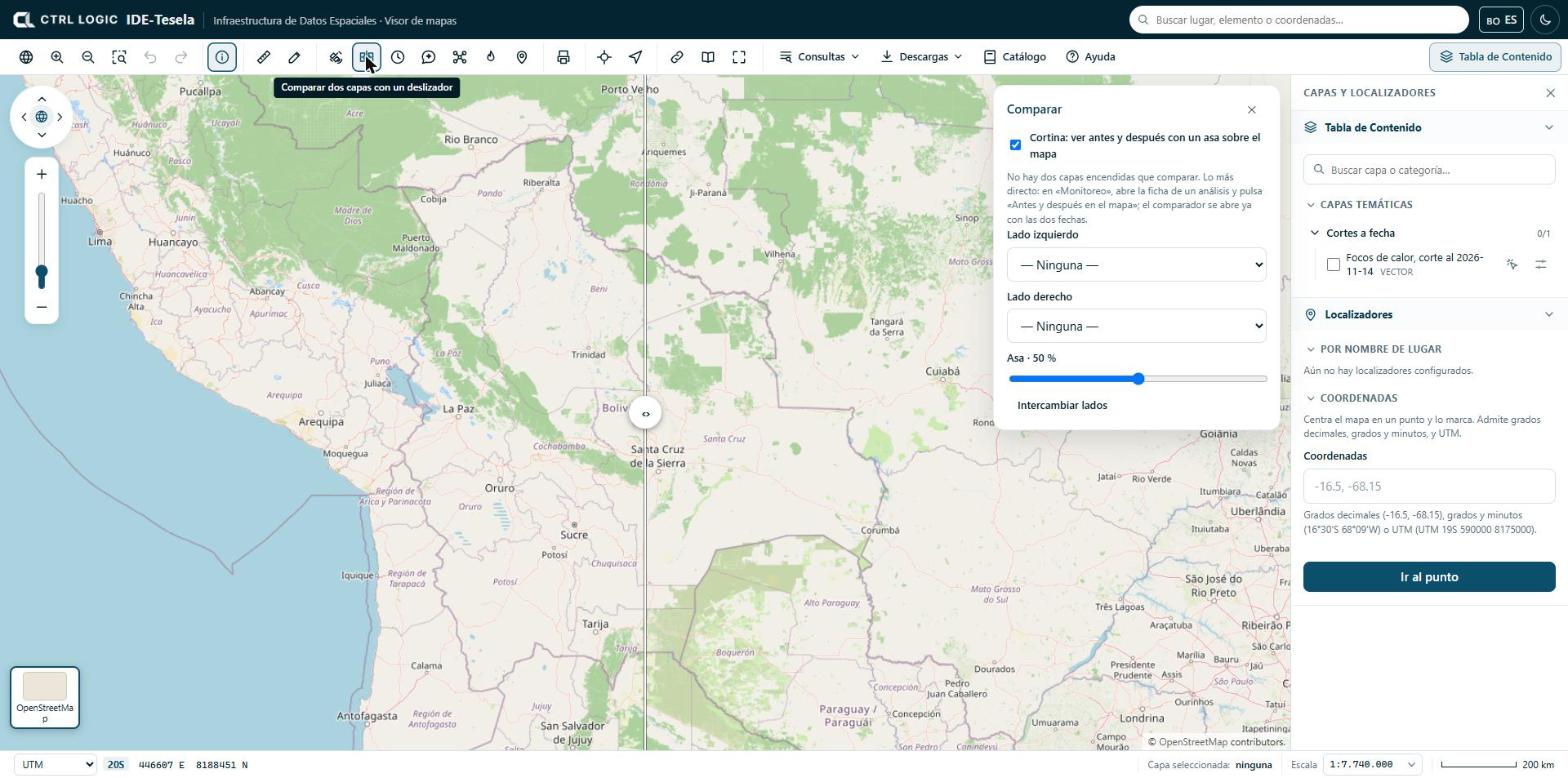
- In the Table of Contents, switch on the layers you want to compare.
- Click “Compare”. By default, the top two layers under “On the map” are compared.
- If you want others, choose them in “Left side” and “Right side”.
- Drag the handle across the map or move the “Handle” slider (it shows the percentage) to divide the space between both sides.
- Click “Swap sides” if you prefer to reverse which one goes on each side.
With the “Swipe” checkbox unticked, the layers are shown whole, with no cropping or handle. If two layers are not switched on, the panel tells you and suggests the following shortcut.
The shortcut: “Before and after on the map”
The most direct way to compare an analysis is to open its sheet from “Monitoring” and click “Before and after on the map”. The comparison tool opens with the two dates already loaded, without you having to switch anything on. In burn analyses, the equivalent is “Compare pre and post-fire”.
When to use each one
| I need to… | Use |
|---|---|
| See what a place looked like on another date, without running any analysis | “Historical” |
| Contrast the “before” and “after” periods of an analysis | “Before and after on the map” or “Compare” |
| Contrast any two layers, for example a scene and a reference map | “Compare” |
Limits
- “Historical” depends on Esri’s imagery archive: not every area has high-resolution imagery on every date.
- The dates in “Historical” are indicative (version date). They are not valid as the date of an event without verifying them with the source.
- The comparison tool is visual: the difference you see is an indication that requires verification, not a calculated result.
Summary
- “Historical” compares the imagery map on two dates with a swipe; the date is that of the map version, not that of the capture.
- “Compare” places two layers that are switched on on either side of a sliding handle.
- “Before and after on the map”, from an analysis sheet, opens the comparison tool already set up.
- What these tools show is visual context and requires verification.
Chapter 9
Drone mission
The mission planner turns an area that you draw on the map into a photographic flight plan: sweep lines, number of photos, distance, time and batteries. It is used to verify in detail, with a drone, an area that the satellite flagged as an indication. Tesela does not control the drone: it generates files that you load into the manufacturer’s app or into QGroundControl.
The plan figures are indicative estimates. The files have not been tested on a real drone: validate them in the simulator or in the manufacturer’s app before flying. The operator is responsible for the flight and for the authorizations and rules of their country; Tesela neither verifies nor manages them.
Opening the planner
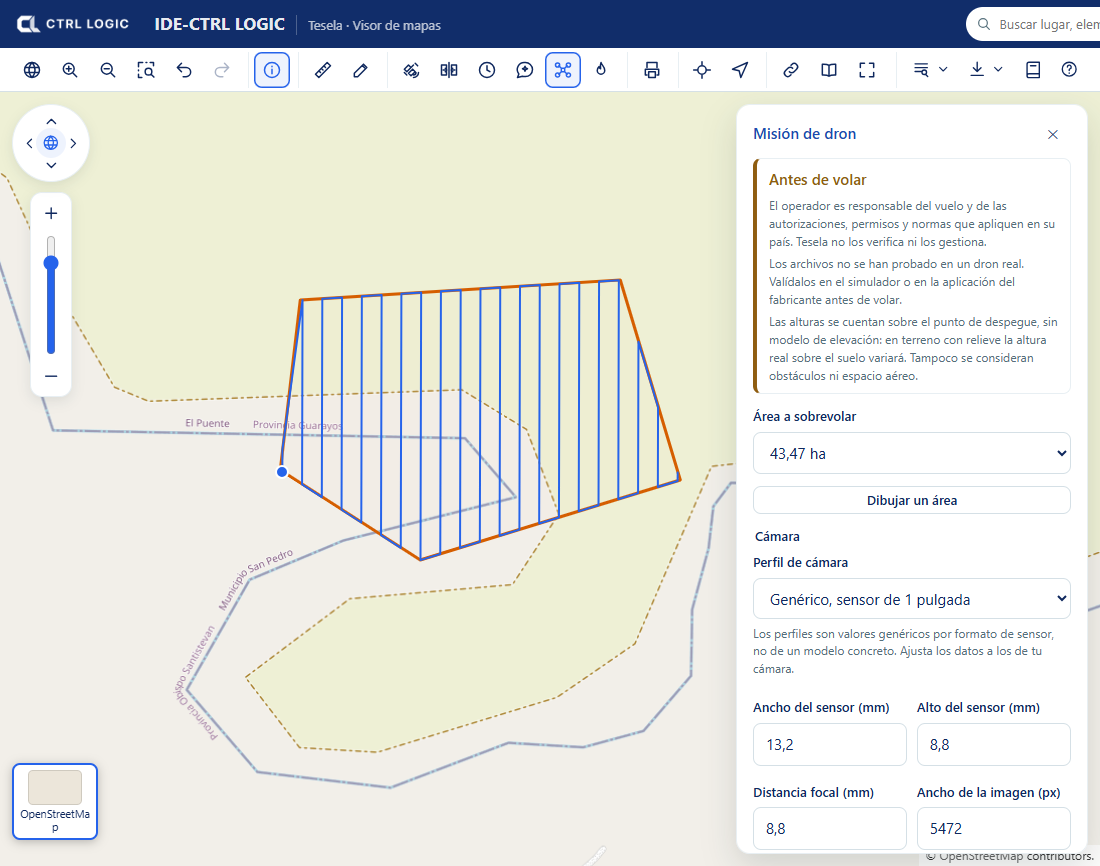
On the viewer toolbar, click the “Drone” button (its help text reads “Plan a drone mission over an area”). The “Drone mission” panel opens with the “Before flying” notice. Read it: it reminds you that heights are counted from the takeoff point, without an elevation model, and that obstacles and airspace are not taken into account.
If you do not see the button, the administrator has left it hidden or reserved for signed-in users (see the chapter “Settings”).
Drawing the area and planning
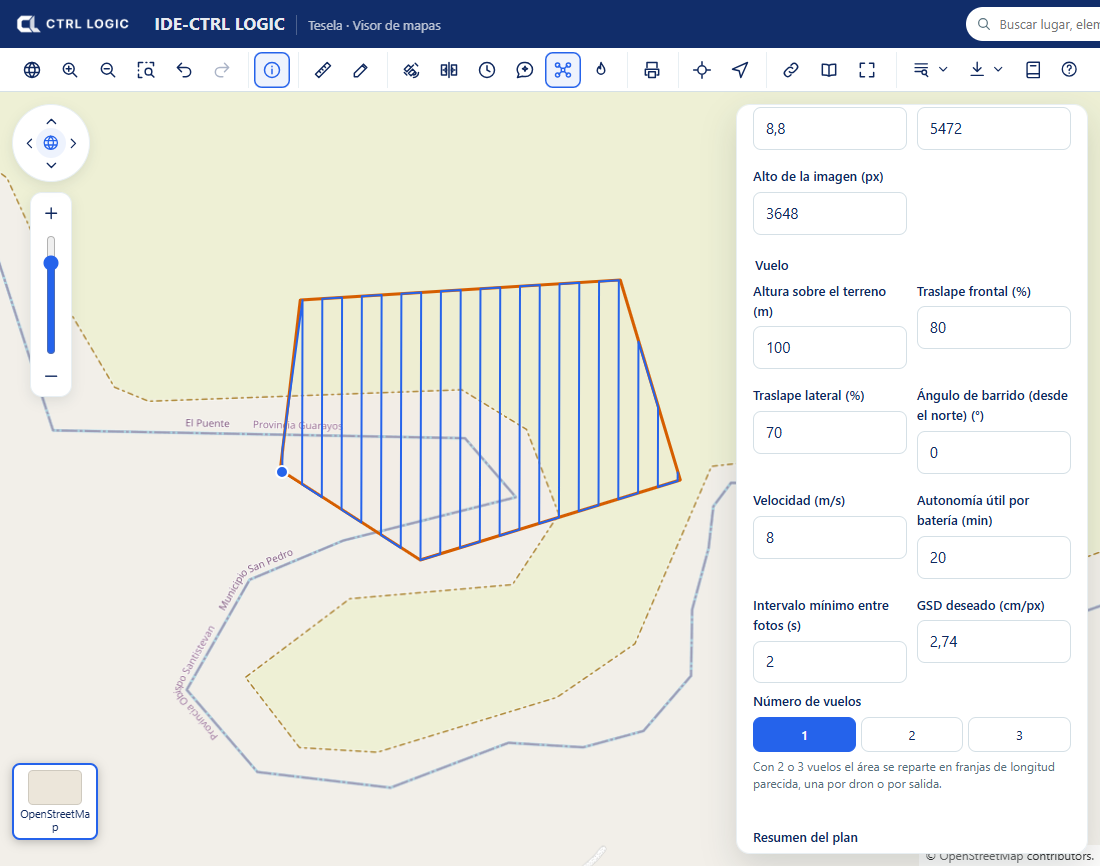
- Click “Draw an area” and trace a polygon or a circle on the map. Clicking the button while you are drawing (“Drawing… (click to cancel)”) cancels the trace.
- Under “Area to fly over”, choose the drawn area. The flight lines appear on the map immediately.
- Choose a “Camera profile” (1-inch sensor, 4/3, 1/2.3-inch or “Custom”) and adjust the data to those of your camera: sensor width and height, focal length and image resolution. The profiles are generic values per sensor format, not for a specific model.
- Define the flight: “Height above ground”, “Front overlap” and “Side overlap”, “Sweep angle (from north)”, “Speed”, “Usable endurance per battery” and “Minimum interval between photos”.
- If you prefer, enter the “Target GSD” (centimeters per pixel): the panel recalculates the height that produces it. Height and GSD are linked.
- Choose the “Number of flights” (1, 2 or 3). With 2 or 3 flights the area is split into strips of similar length, one per drone or per sortie.
Reading the plan summary
The “Plan summary” block shows the area, the GSD, the footprint of one photo, the spacing between lines, the distance between photos, the sweep lines, the number of photos, the total distance, the estimated time and the batteries required. If you split the area into several flights, the “Missions” section details each one (photos, kilometers, time and batteries).
The panel warns you when something does not add up. For example, if at the chosen speed the camera would have to shoot faster than its minimum interval, it suggests lowering the speed or the front overlap. It also rejects plans outside the limits: a maximum of 1,000 ha per plan and 5 km along the longer side of the area. A drone does not cover a territory: draw only the zone you are going to fly over and split large areas into several plans.
Exporting
Each mission has two download buttons:
| Button | What it is for |
|---|---|
| “DJI (KMZ)” | Route file for DJI’s flight app. |
| “QGroundControl (.plan)” | Mission plan for QGroundControl. |
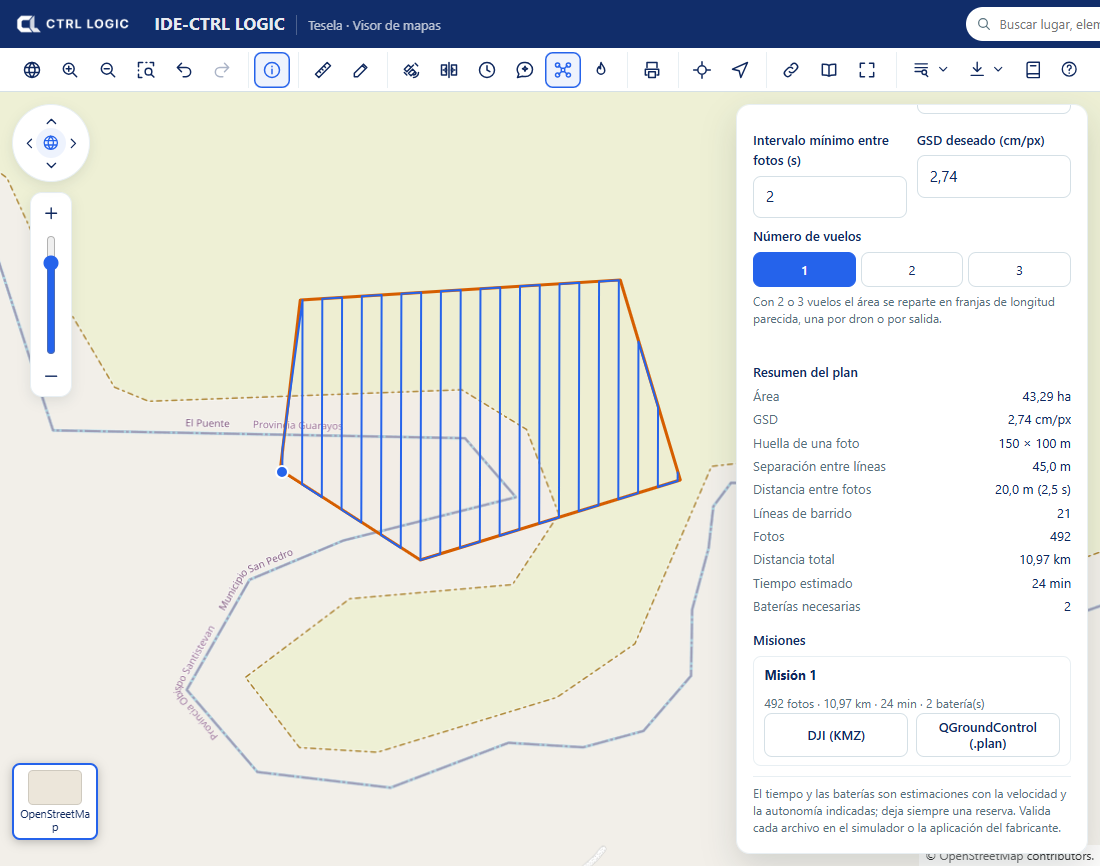
Always keep a battery reserve. Time and batteries are calculated from the speed and endurance you entered; if those figures are optimistic, the plan will be too.
Summary
- Draw the area, adjust camera and flight, and read the plan summary.
- Split the area into up to 3 flights if necessary.
- Export to DJI (KMZ) or QGroundControl (.plan) and validate in a simulator before flying.
- The estimates are indicative; responsibility for the flight lies with the operator.
Chapter 10
“Ask the map” assistant
The assistant is a conversation panel inside the viewer. You ask it in plain language about layers, the features they contain or a place, and it answers with what it finds in the system. It is the only part of Tesela that uses artificial intelligence: change detection is mathematical and does not depend on it.
Opening the assistant
- On the viewer toolbar, click the “Assistant” button (its help text reads “Ask the map about the layers and analyses”).
- Type your question in the “Ask the map…” box and click “Send”. While it answers you will see “Thinking…”.
- To start another topic, click “New conversation”. The assistant takes into account only the latest messages of the current conversation.
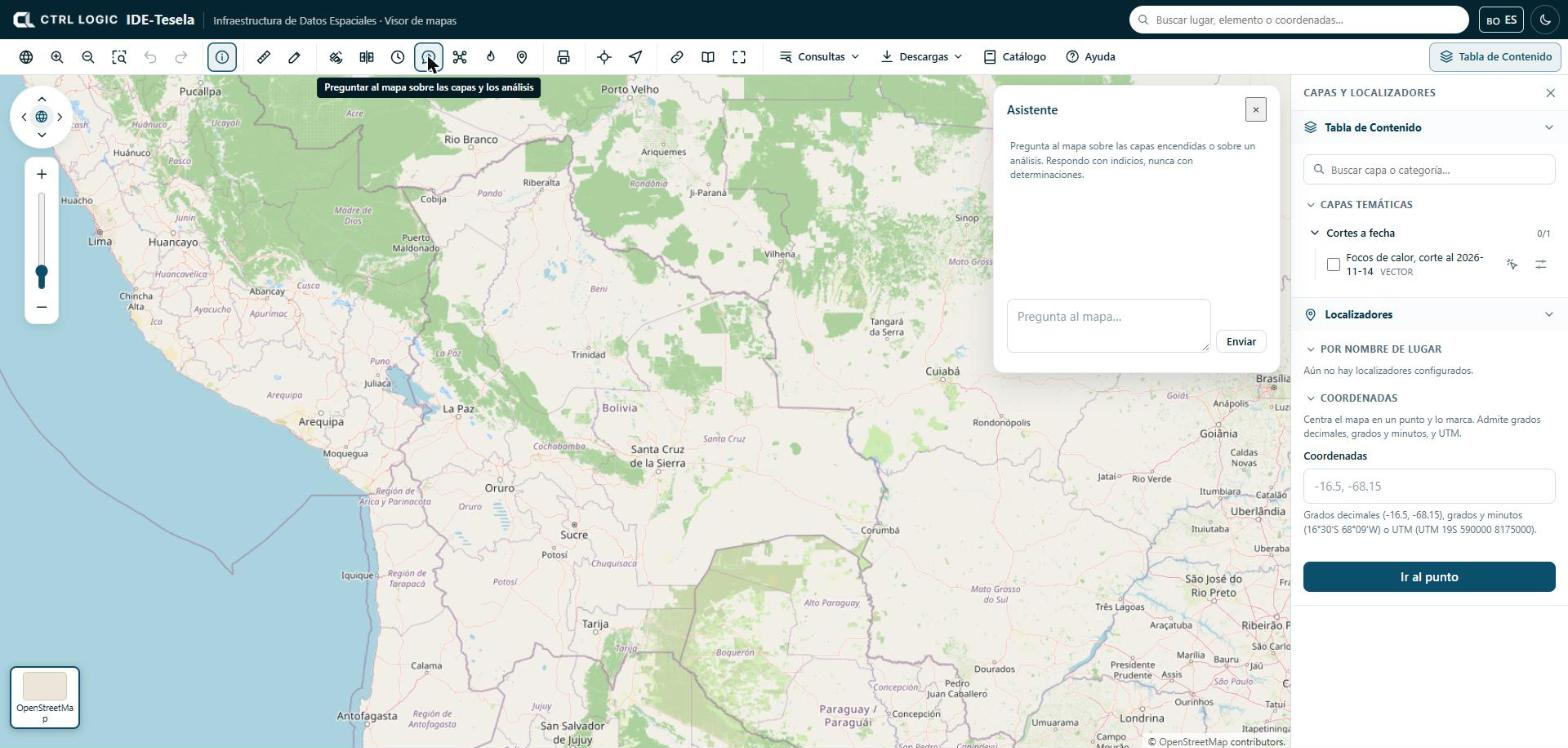
The button appears only if your profile has the “Use the assistant” permission and the administrator left the “Assistant” option visible for you.
What it can do
The assistant has five tools, deliberately few:
| Tool | What it does |
|---|---|
| List layers | Shows the catalog layers that you can see, with their name, type and category. |
| Count features | Counts how many features a vector layer has, optionally within a box on the map. |
| Summarize a field | Says which values a field has and how many features there are of each; if it is numeric, it also gives the sum, mean, minimum and maximum. |
| List the fields of a layer | Says which fields a layer has and the type of each. |
| Find a place | Locates a place or a feature by its name. |
Useful questions
- “Which layers are available about protected areas?”
- “How many features does the municipalities layer have?”
- “Which fields does this layer have?”
- “What types are there and how many of each in the category field?”
- “Where is such-and-such municipality?”
Ask about what is in the layers. If something is not in the available information, the assistant should say so instead of assuming it. It answers in the language in which you ask.
What it does not do
- It does not modify anything. It is read-only by design: it cannot write, delete or publish. It uses the same queries as the viewer.
- It uses your permissions. If you cannot see a layer, neither can the assistant.
- It does not determine. It speaks of indications, alterations or activity consistent with something, and reminds you that they require verification. It does not state that anything is illegal or confirmed.
The assistant can make mistakes, like any language model. Check important figures against the attribute table or the analysis sheet.
If it does not answer
When the assistant cannot answer (for example, because no provider is configured, the key has expired, the quota has run out or there is no connection), you always see the same message: “The request cannot be processed right now. Please contact the administrator.” The provider is not named. The technical detail stays in the server log, available to the administrator.
For the administrator: choosing a provider and key
In the menu, under the “Settings” group, open “AI assistant” (it requires the “Manage the assistant” permission). There you choose the model provider: Claude from Anthropic, ChatGPT from OpenAI or Gemini from Google. Only one can be active at a time.
- Choose the provider and enter the “Model” (you can consult the list of models it offers or type the name).
- Paste the “API key”. It is stored encrypted on the server and is never shown again: you will only see “saved”.
- Click “Test connection”. If it succeeds, click “Turn on”.
- Optional, under “Advanced settings”: maximum tokens per response, temperature, service address and assistant instruction. If you leave the instruction empty, the system’s own is used, which already includes the cautious-language rules.
What is asked of the assistant is sent to the chosen provider’s service: the text of the query and what the person has on screen. No data from restricted layers is sent. Keep this in mind when choosing a provider.
Summary
- Conversation panel in the viewer, read-only and with your permissions.
- Five tools: list layers, count features, summarize a field, list fields and find a place.
- It answers with indications and asks for verification.
- The administrator chooses provider and key under “Settings” → “AI assistant”; the key never leaves the server.
- Whatever the failure, you will see the same message and should contact the administrator.
Chapter 11
Field: observations from the ground
An indication detected from the satellite is confirmed or ruled out by looking at the site. Tesela offers two ways to record and consult what a field team sees: the “Tesela Field” mobile app (Android), designed to work in the field even without a connection, and the “Field” tool in the viewer, for consulting records on the map and, with permission, creating and correcting them.
Each observation is a record of what was observed at the site and requires verification. It is not a determination about the cause or legality of what was recorded.
Part 1. The “Tesela Field” app
Signing in
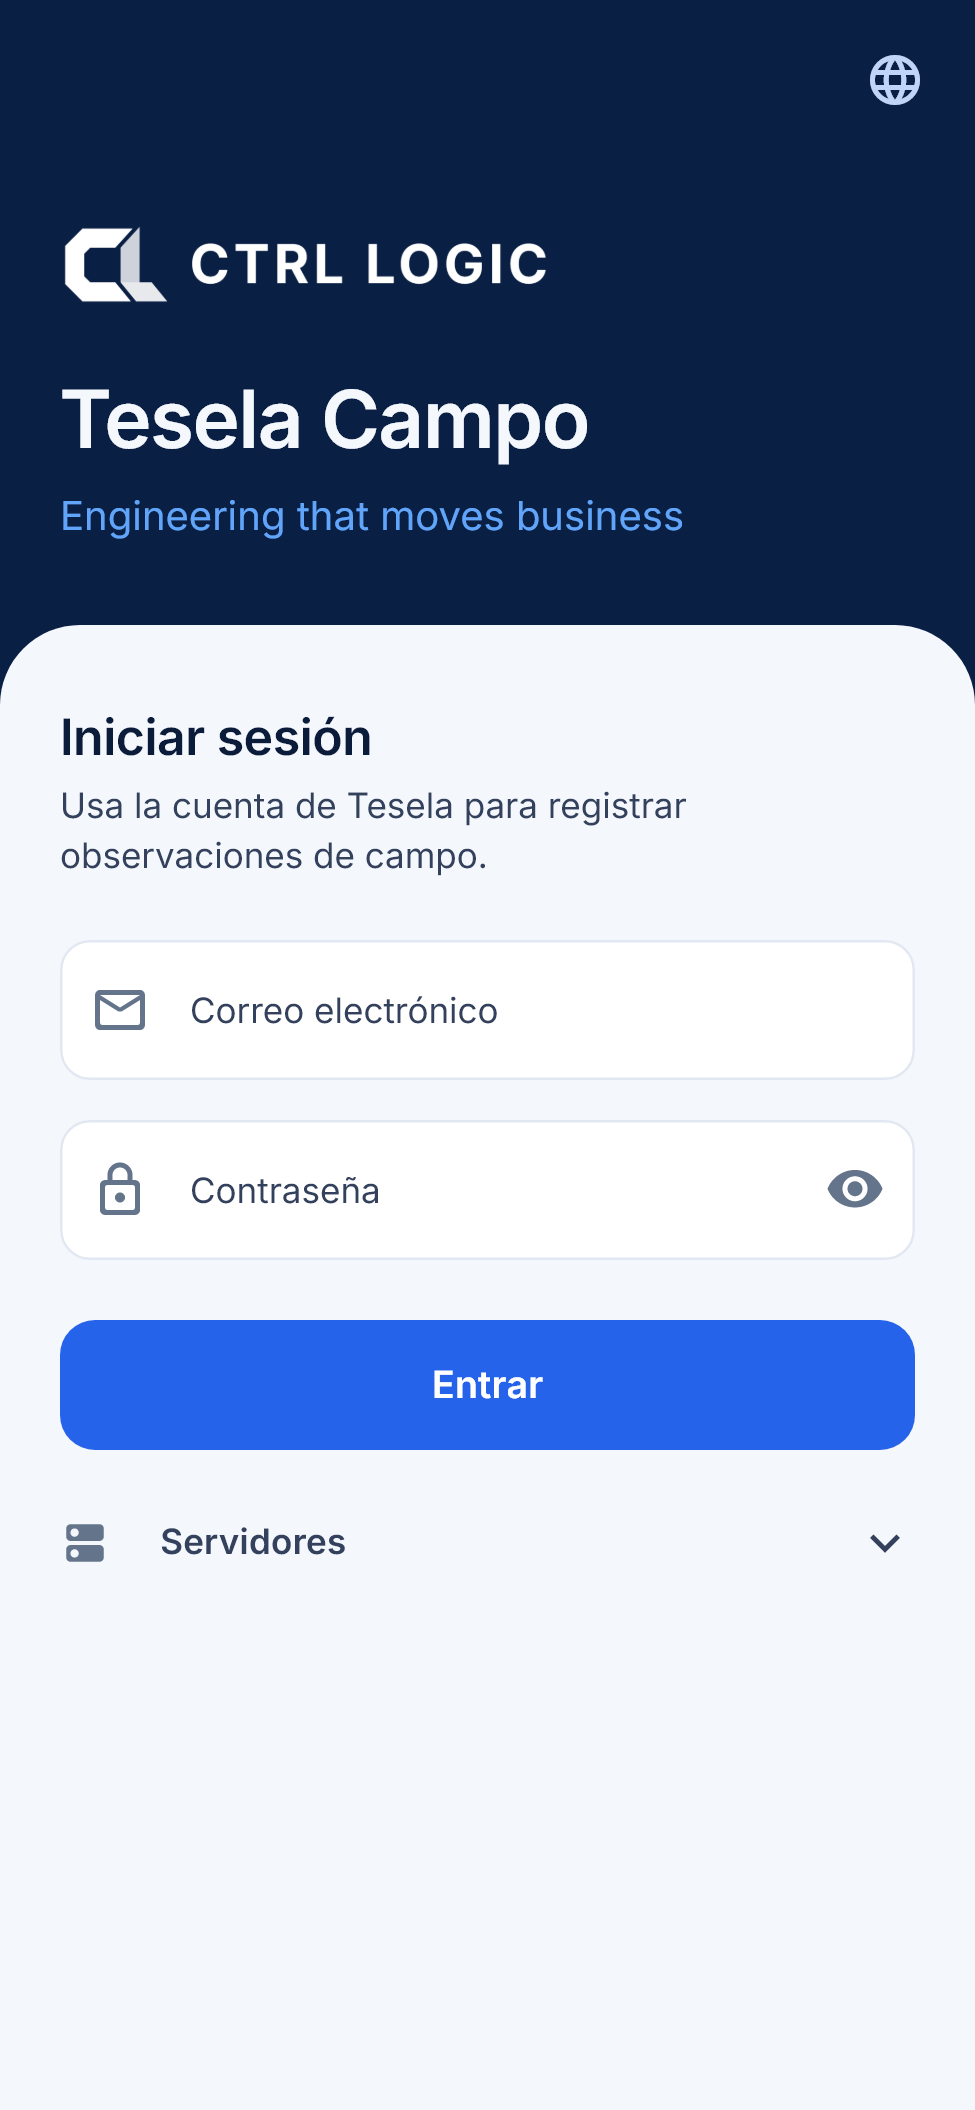
Open the app, enter your email address and your Tesela password and tap “Sign in”. The first time you need a connection; afterwards you can work without one until the session expires (“Settings” shows how much time is left). Your account must have field permissions: if you see “This account has no field permissions”, ask the administrator for them.
Recording an observation
- On the “Record” tab, choose the “Record type”: “Inspection point”, “Alteration observation”, “Access observation” or “Other”.
- Enter a “Title” (optional, up to 120 characters) so you can recognize the record later.
- Enter the “Description” of what was observed, up to 2,000 characters. Limit yourself to what you see: it is an observation that requires verification.
- Check the “Location”. The app takes the GPS and shows the estimated accuracy (for example, “±4 m”) and the signal quality. With “Refresh GPS” you measure again. If GPS is not available, you can enter latitude and longitude by hand.
- Add evidence with “Take photo”, “Record video” or “Gallery”. JPEG, PNG, HEIC, MP4 and QuickTime are accepted; up to 20 files per record, with a maximum of 25 MB per image and 300 MB per video.
- Optionally, link the record to a finding or detection in Tesela with “Tesela reference”.
- Tap “Save on device”. The record is stored on the phone and will be sent as soon as there is a connection.
It works offline and synchronizes
Everything is saved first on the phone, so you can record in areas without coverage. When there is a connection, the app sends the records in batches, in such a way that a retry does not duplicate anything. Photos and videos are uploaded in chunks: if the connection drops, the upload resumes from where it stopped instead of starting again. The server checks that each file arrived complete and that its content matches its type.
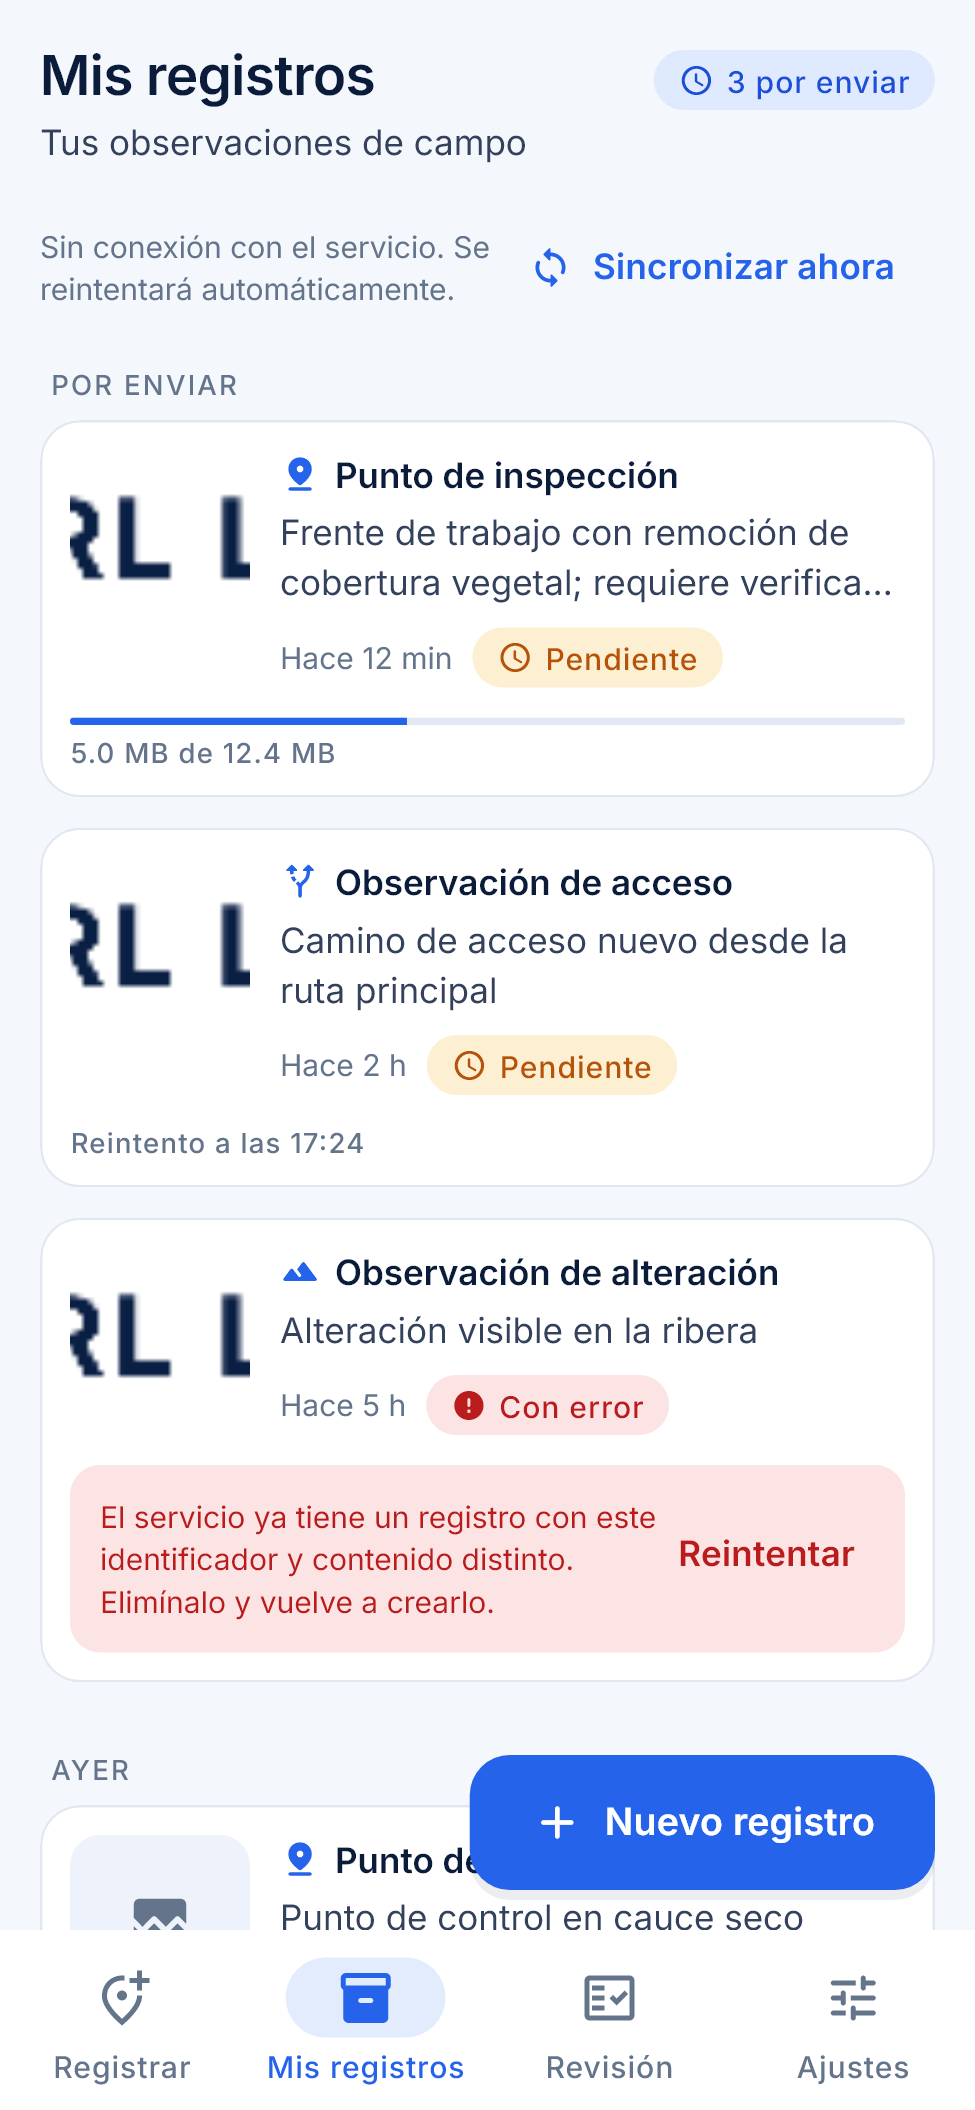
Under “My records” you see your observations grouped by date, with their status:
| Status | Meaning |
|---|---|
| Pending | Saved on the phone, waiting to be sent. It may show the time of the next retry. |
| Uploading | The evidence is being sent; progress is shown in megabytes. |
| Sent | Received by the service. |
| Failed | Sending stopped; the message explains why and you can use “Retry”. |
“Sync now” forces a send. If you open a record, “Record detail” shows the location, date, attachments and the synchronization stages (saved on the device, in the send queue, uploading evidence, received by the service).
Review, settings and language
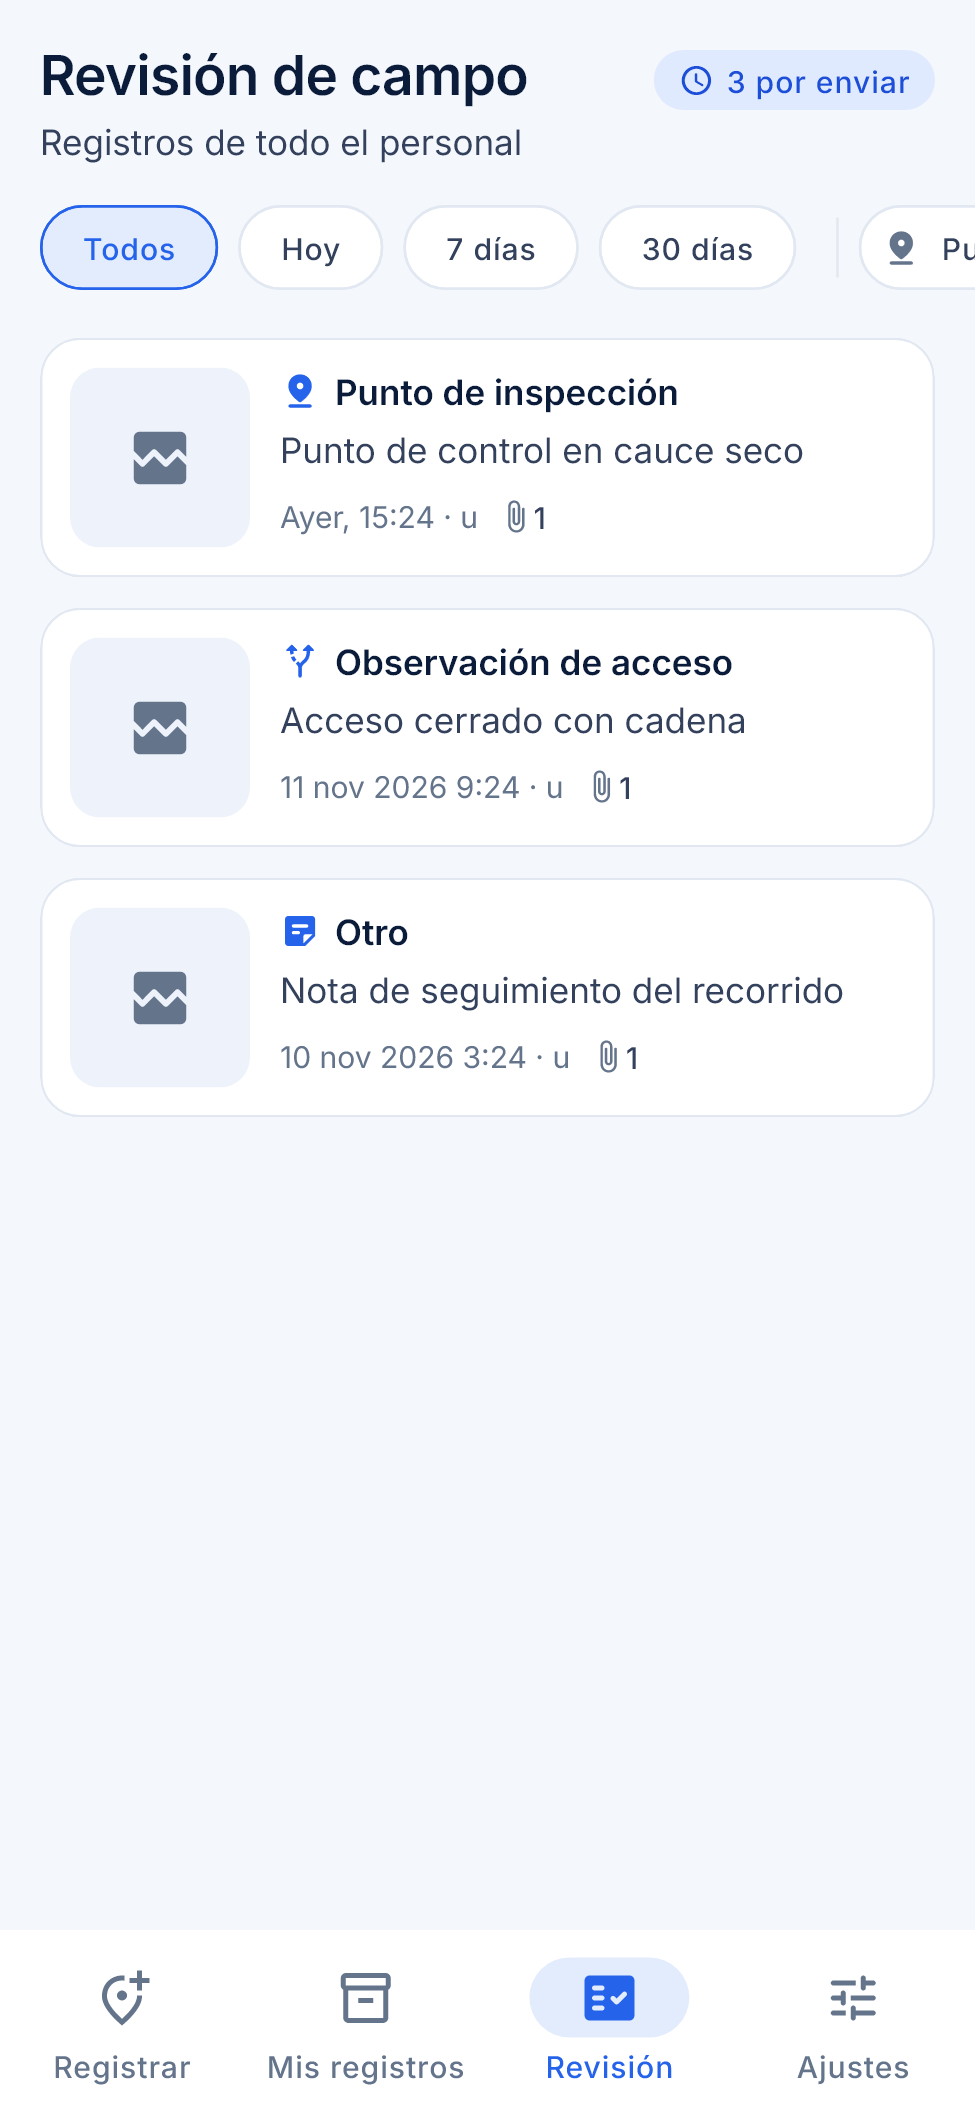
Anyone with the review permission sees the “Review” tab: the records of all staff, with filters by date (“Today”, “7 days”, “30 days”), type and author. Review needs a connection. Under “Settings” you choose the language (Spanish, English or Portuguese, or the system’s), the theme (system, light or dark), force synchronization and sign out.
Part 2. The “Field” tool in the viewer
In the viewer, the “Field” button (location icon) opens the “Field observations” panel. It appears only for those who have the permission to review field data.
- The list shows each observation with its type, who reported it, when it was captured and its location. “Show all on the map” draws the points, labeled.
- When you open an observation you see its sheet with the evidence (photos and video) and the reminder “This is a record of what was observed on site. It requires verification.”
New observation from the viewer
- Click “New observation” (you need the permission to record field data).
- Click on the map to choose the point. If you make a mistake, click again to move it.
- Choose the type (“Inspection point”, “Observed alteration”, “Observed access” or “Other”) and, if you wish, enter the title and the description.
- Under “Photos or videos”, attach the files: JPG, PNG, HEIC, MP4 or MOV, up to 20 files, with a maximum of 25 MB per photo and 300 MB per video.
- Click “Save observation”. The panel shows the upload progress of each file.
Editing and deleting
Anyone who reviews field data can click “Edit” to correct the type, the title and the description, and then “Save changes”. The location, the date and the files are not modified: they are the evidence.
“Delete” asks for confirmation (“The observation and its photos or videos will be deleted. This cannot be undone.”) and removes the observation together with its files.
Summary
- The “Tesela Field” app records type, optional title (120 characters), description (2,000), GPS location with accuracy, photos and video.
- It works offline and synchronizes in batches; file uploads resume in chunks.
- “My records” shows the status of each submission; “Review” is for those who supervise.
- In the viewer, “Field” lists, maps and shows the evidence; it allows creating, editing and deleting with the appropriate permissions.
- Every observation requires verification.
Chapter 12
Snapshots and sources
Tesela’s “live” layers (heat hotspots, burns) change when new data arrives. That is useful for exploring, but not for delivering a report that someone must be able to reproduce months later. Snapshots exist for that purpose. Alongside them, the “Sources and licenses” panel tells you where the data comes from and how you must cite it.
Snapshots
A snapshot is a frozen, immutable copy of the state of the data on a given date, published as a new catalog layer. The idea is simple: the live layer is for exploring; the snapshot is what is cited and delivered.
What a snapshot contains
- The data of the range or of the analysis: for heat hotspots, each hotspot with its source, satellite, confidence and radiative power; for burns, the areas with their estimated severity and their mean dNBR.
- The municipality and the protected area of each feature, as text in addition to their number.
- An ISO 19115 metadata record with range, sources, parameters, licenses, attribution and the SHA-256 fingerprint of the data. The fingerprint is a digital signature: if a single data item changed, the signature would be different.
How to publish a snapshot
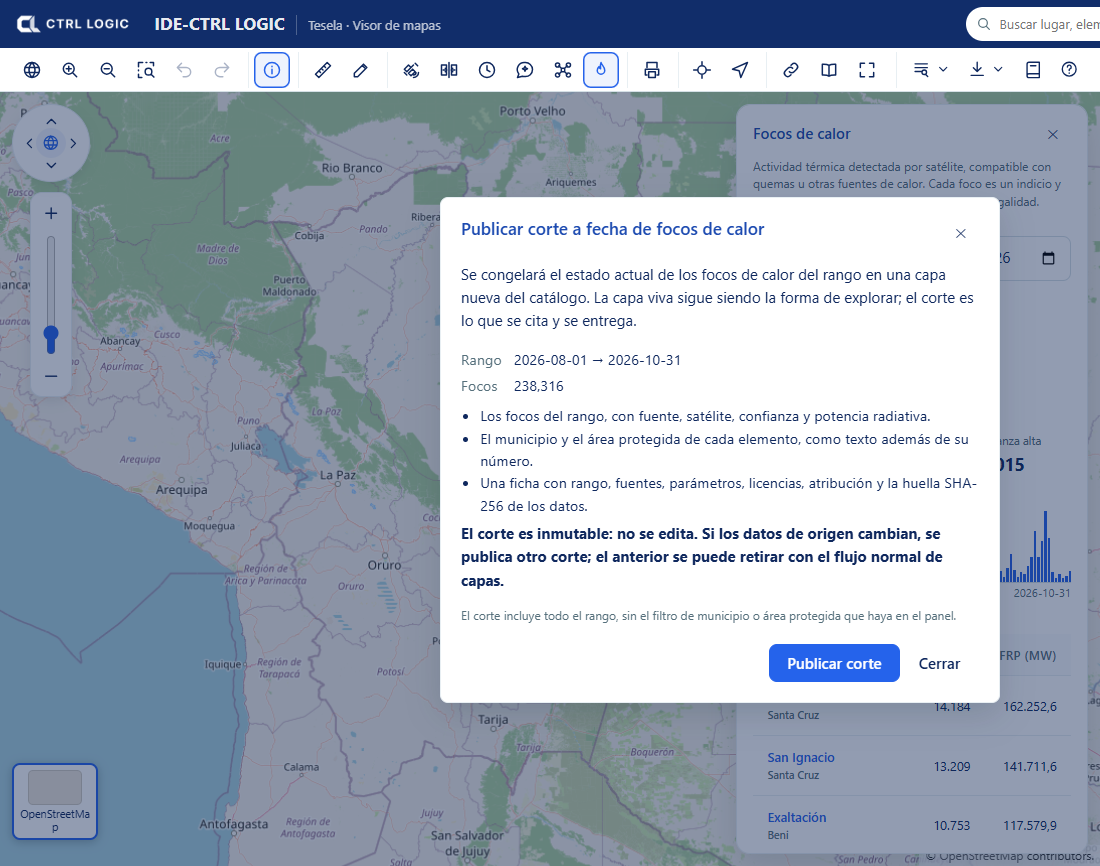
- In the “Heat hotspots” panel, or in the sheet of a burn analysis, click “Publish snapshot”. You need the “Publish and withdraw” permission.
- Read the dialog: it states the range, the number of features and what will be frozen. The snapshot includes the whole range, without any municipality or protected-area filter that you have set in the panel.
- Click “Publish snapshot”. When it finishes you will see the layer, the snapshot date, the features and the SHA-256 fingerprint, with links to “Open the layer record” and “Go to the catalog”.
Rules worth knowing
- Immutable. A snapshot is not edited. If the source data changes, another snapshot is published; the previous one can be withdrawn through the normal layer flow (see “Catalog and layers”).
- Idempotent. With the same parameters and the same data on the same day, no duplicate is created: the system warns “An identical snapshot from today already existed” and shows you that one.
- Reproducible. What you deliver today can be verified tomorrow by comparing the SHA-256 fingerprint.
- With its own record. The snapshot layer appears in the “Snapshots” group of the table of contents and in the catalog. If the record is left incomplete (for example, without a contact), the catalog warns you and it is advisable to complete it before delivering the snapshot.
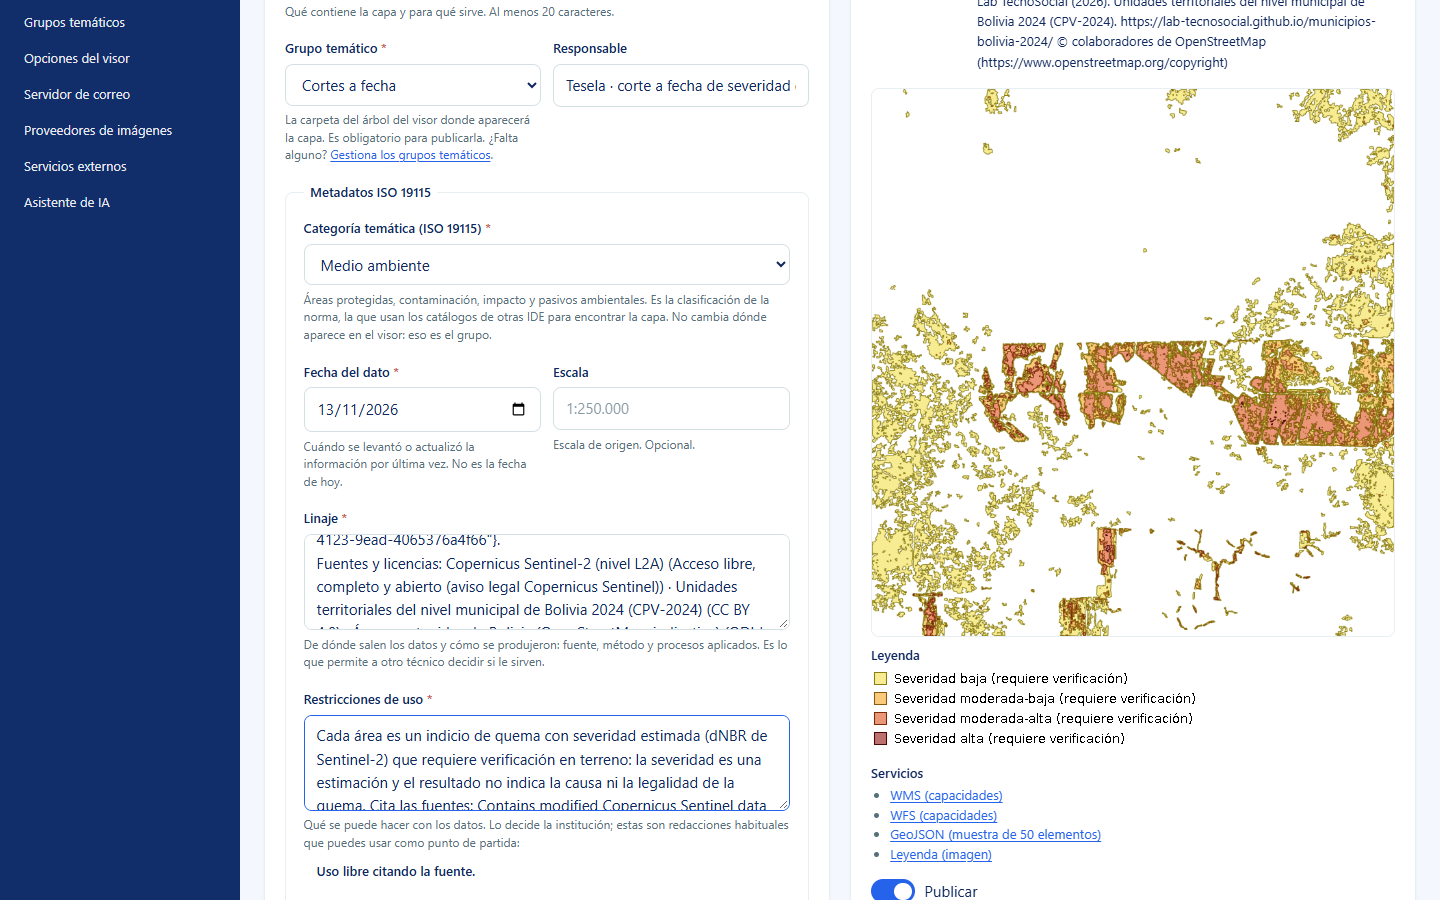
A snapshot freezes indications, not conclusions. Each feature still requires verification, as its legend and its use restrictions state.
Sources and licenses
The “Sources” button on the viewer toolbar (“Data sources and licenses”) opens a panel with the origin, license and attribution text of the third-party data used by Tesela. When you reuse a dataset, cite the source as indicated.
For each source the panel shows:
- The name and the institution that produces it.
- The “License”, with a link to the text.
- The “Attribution”: the exact phrase you must include when citing.
- The “Data version” and the download date (“Downloaded on”), where applicable.
- A usage caveat. For example, the protected areas in the demonstration come from OpenStreetMap and are indicative and non-exhaustive: they may omit areas and their boundaries are not the official ones.
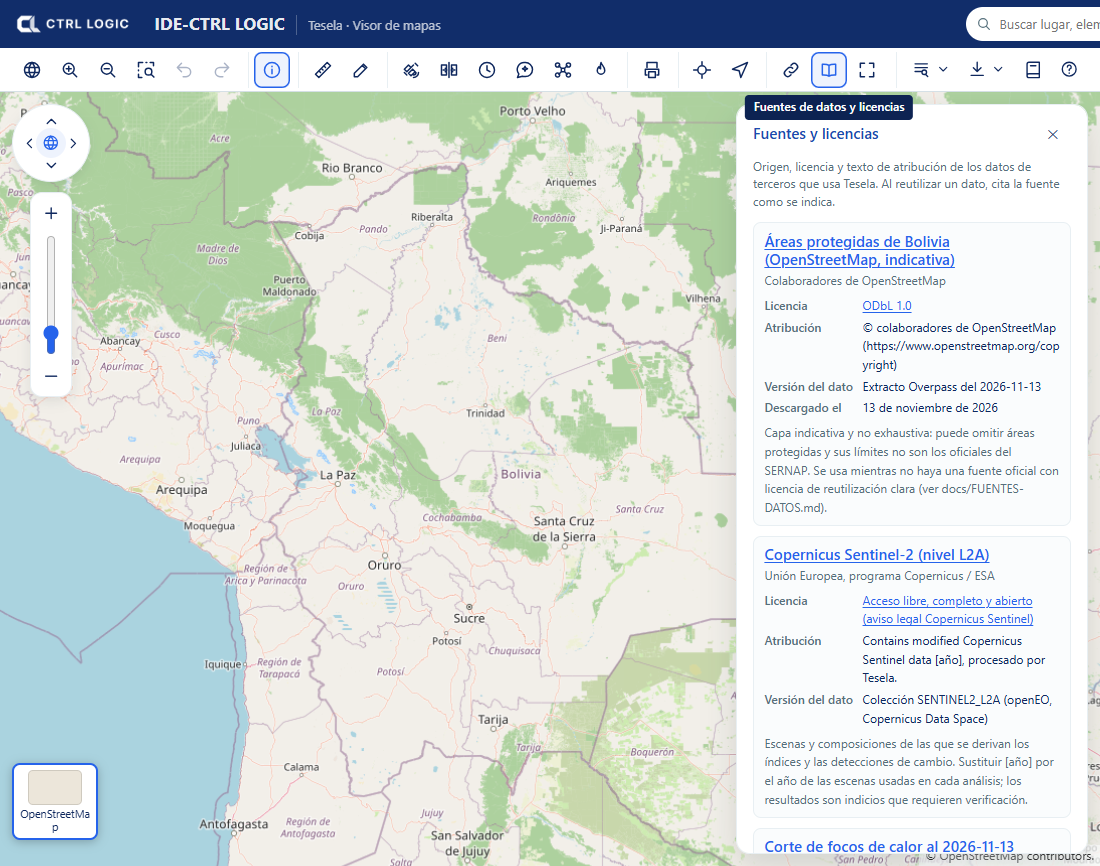
The external layers registered by the administrator (see “Settings”) also show their owning institution next to each layer. That data belongs to third parties and is only displayed: Tesela does not validate it or answer for how current it is.
Summary
- Live layer for exploring, snapshot for delivering.
- A snapshot is a frozen, immutable copy, with an ISO record and SHA-256 fingerprint; repeating it with the same data does not create a duplicate.
- “Sources and licenses” tells you where each dataset comes from and how to cite it.
Chapter 13
Catalog and layers
The catalog is the list of all the layers in the system: the reference layers that you upload (boundaries, protected areas, land cover) and the snapshots. From it you upload a new layer, complete its metadata record, give it a style, and publish or withdraw it. This chapter is for those who manage data; it requires the corresponding permissions (for example, “View the catalog”, “Upload data”, “Edit records”, “Publish and withdraw” and “Manage styles”).
The catalog list
In the menu, under the “Data” group, open “Layer catalog”. At the top you have the search box (by title, summary or technical name) and the “Status” filter. For each layer the table shows the title, the technical name, the type (vector or raster), the geometry, the number of records, the status, the “Loaded on start” option, the record and the actions.
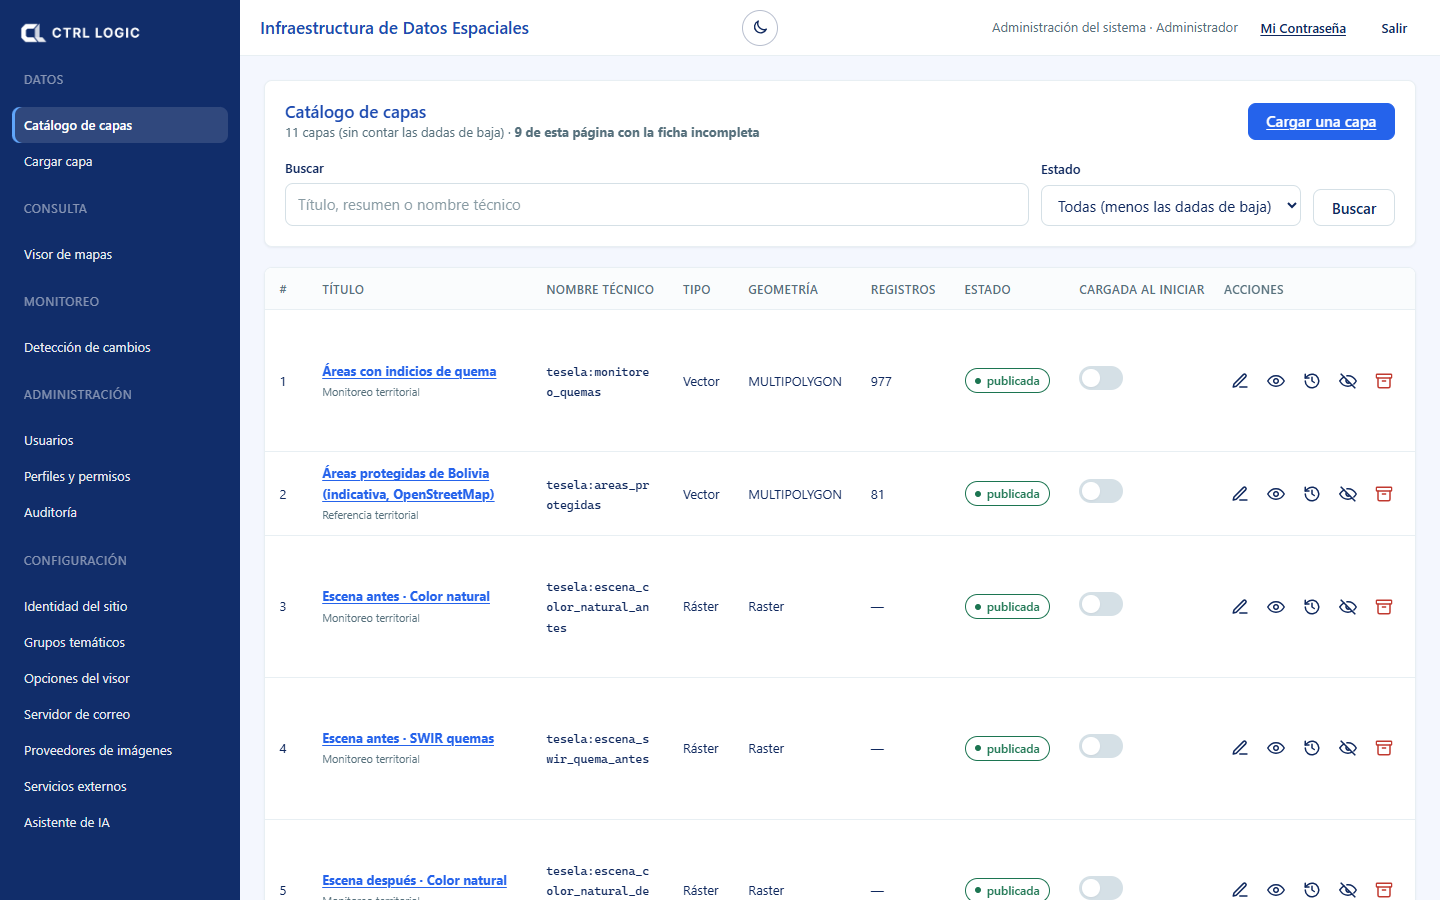
Layer statuses
| Status | What it means |
|---|---|
| Draft | Uploaded but not visible in the viewer. It is the status in which every new layer, and every restored layer, is left. |
| Published | Visible in the viewer and in the WMS services (and WFS if it is vector). |
| Withdrawn | It is no longer shown in the viewer, but the data remains in the database: nothing has been deleted. |
| Archived (decommissioned) | It leaves the usual list and is found by choosing the “Archived” status. Its data is retained and its technical name remains reserved. |
An “internal” layer (label next to the status) is visible only when signed in. A layer without a thematic group cannot be published: the “no group” mark appears.
Complete or incomplete record
Each layer has an ISO 19115 metadata record. The “Record” column marks it “complete” or “incomplete” and indicates what is missing (“Incomplete: missing contact”). Completing it is what distinguishes a map server from a data infrastructure: whoever finds the layer will know what it is, where it comes from and how it can be used. The catalog tells you how many records on the page are incomplete.
Actions per layer
- Edit record: title, summary, group, ISO category, data date, lineage, use restrictions, license, contact and keywords. If your profile does not allow editing, you see “View record”.
- Preview: map and legend generated by GeoServer. It exists only for published layers.
- Audit: who uploaded it, last modification and last publication; the full change history requires the “View audit trail” permission.
- Publish / Withdraw from the portal: makes the layer visible or hides it from the viewer.
- Decommission: archives it. The confirmation dialog details what happens: it is no longer shown, it leaves the list and its data is retained.
- Restore: undoes the decommissioning; the layer returns as a draft and must be published again.
The internal monitoring layers (scenes, detections, hotspots) are not decommissioned from the catalog: they hold the results of all analyses and are shared. Analyses are archived or deleted under “Monitoring” (the “Archive” and “Delete” buttons in the analysis panel).
“Loaded on start”
The “Loaded on start” switch turns the layer on automatically when the viewer opens. It works only on published layers; on a withdrawn layer “no effect” appears. Use it with few layers: those that everyone needs to see on entering.
Uploading a layer
Click “Upload a layer” or open “Upload layer” in the menu. The wizard advances in five steps; the database is not touched until step 3 and nothing is published until step 5.
- Choose the file. Vector layers: a shapefile compressed in a .zip (with .shp, .shx, .dbf and .prj), a GeoPackage, GeoJSON or KML. Raster: a GeoTIFF. Maximum size 512 MB.
- Confirm the projection. If the file does not declare its coordinate system, Tesela assumes none: choose it yourself, because a wrong projection places the layer in the wrong location without giving any error. Enter the technical name (lowercase letters, numbers and underscores, 3 to 63 characters) and click “Import into the database” (or “Import the raster”).
- Review the result. Invalid geometries are shown, if there are any, with the “Fix automatically” option, and the layer is checked to ensure that it lies within Bolivian territory.
- Describe the layer. Complete the record: title, summary (at least 20 characters), group, ISO category, lineage, restrictions, contact and who will be able to see it (“Public” or “Internal”). Click “Save record”.
- Publish. “Publish the layer” registers it in GeoServer; it appears on its own in the viewer and in the WMS services (and WFS if it is vector).
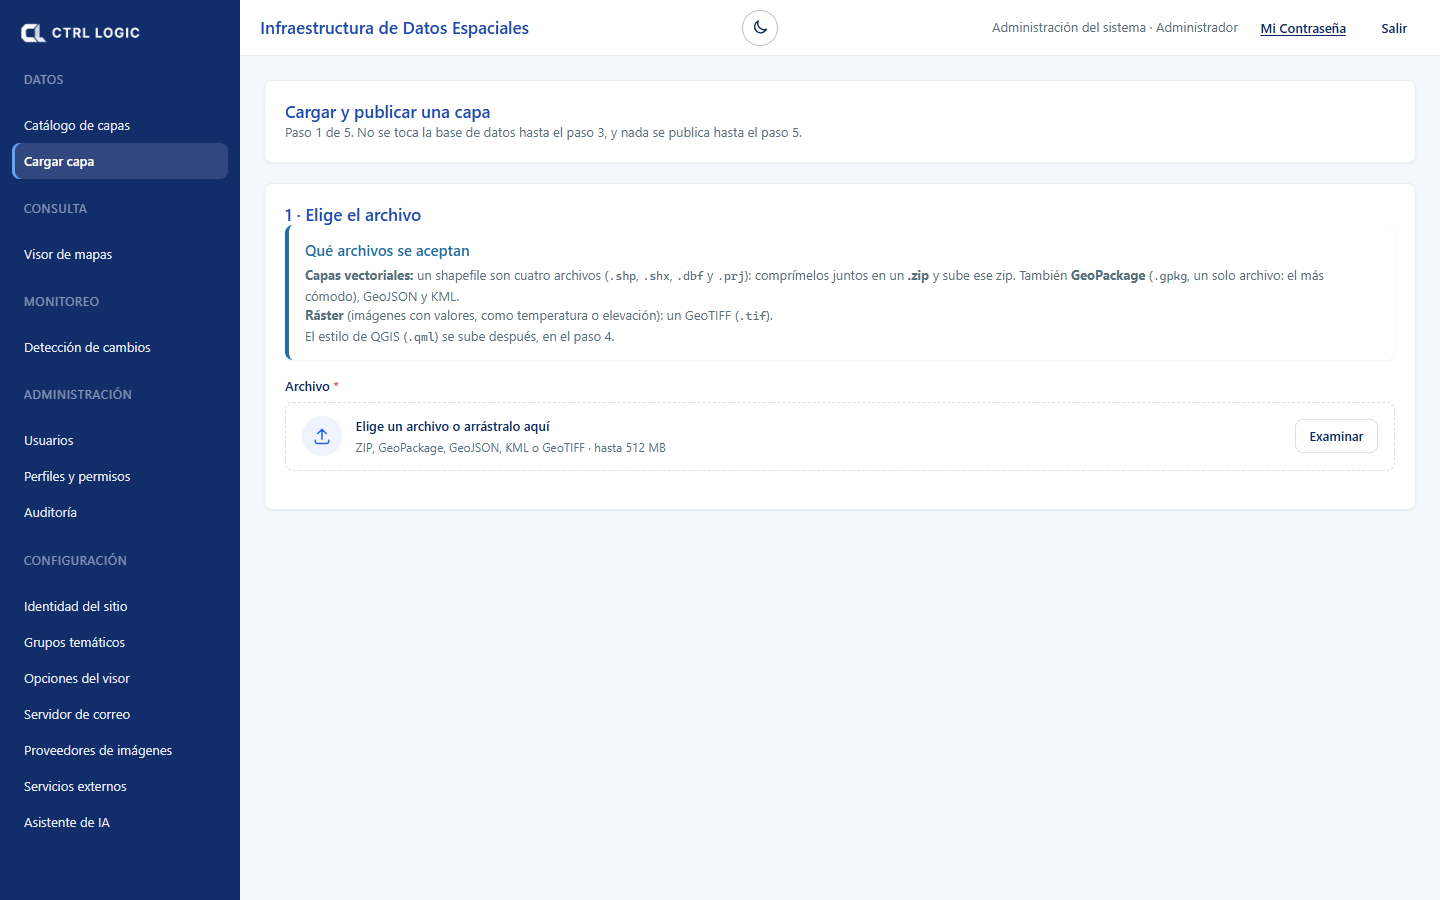
Style: how a layer is drawn
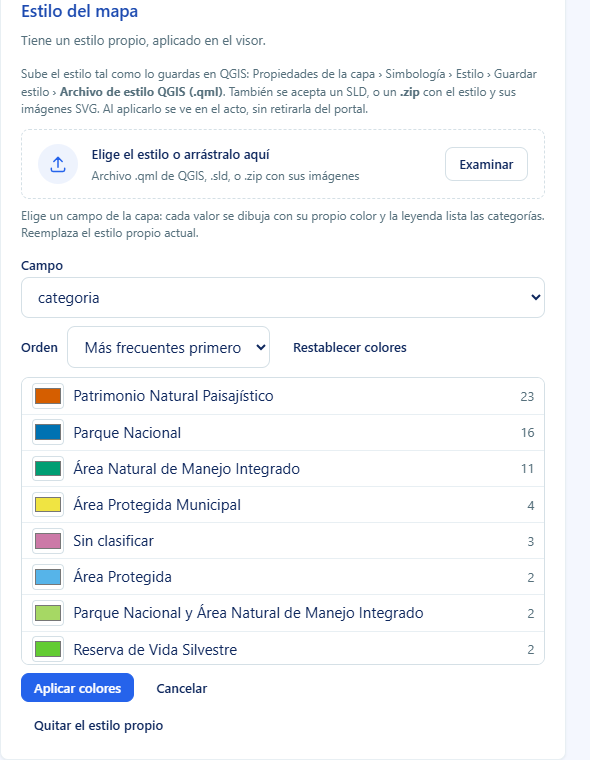
In the layer record, the “Map style” block lets you upload a QGIS style (.qml), an SLD or a .zip with the style and its images. You can also color by a field, without needing QGIS:
- Click “Color by field” and choose a “Field” of the layer.
- The values are listed with their frequency and an editable color for each. Change the “Order” (most frequent first or alphabetical) or “Reset colors”.
- Check the legend preview and click “Apply colors”. If the field has many distinct values, the most frequent ones are shown and the rest is drawn as “Other”; a field with few values is advisable.
If the layer is published, the style is visible immediately. If it is a draft, it is applied on publication. “Remove the custom style” restores GeoServer’s generic style.
Summary
- The catalog lists layers with their status: draft, published, withdrawn or archived.
- The ISO 19115 record must be complete; the catalog flags incomplete ones.
- Actions: edit record, preview, audit, publish or withdraw, decommission and restore.
- “Loaded on start” switches the layer on when the viewer opens.
- The internal monitoring layers are not decommissioned here: analyses are archived or deleted under “Monitoring”.
Chapter 14
Users, profiles and audit
Tesela controls who gets in and what each person can do through user accounts, profiles with permissions and a hierarchy of ranks. Everything that happens is recorded in a searchable audit trail. This chapter describes those screens in text; because they contain personal data, they are not illustrated with screenshots.
Where everything is
In the side menu, under the “Administration” group, you will find “Users”, “Profiles and permissions” and “Audit”. Each option is shown only if your profile has the corresponding permission (“Manage users”, “Manage profiles” and “View audit trail”). In the header you have “My Password” and “Sign out”.
The rank hierarchy
Each profile has a rank, a number from 0 up to a maximum: the higher the number, the more power. You manage only profiles and users of a rank lower than yours. In practice:
- In the user list you see only people with a rank lower than yours and your own account (marked “your account”).
- You cannot create or edit someone of your own rank or higher, nor assign a profile of a rank equal to or higher than yours.
- You cannot grant a permission that your own profile does not have: the system prevents it.
Users
The “Users” screen shows the number of registered accounts, a search box (name, email or unit) and a status filter (“All”, “Active” or “Deactivated”). The table lists the person, the profile, the unit, the last access and the status (“active”, “deactivated” or “must change password”).
Creating a user
- Click “New user”.
- Complete the “Institutional email” (it identifies the account and cannot be changed afterwards), the “Full name” and the profile. Optionally, position, phone, unit and personal details.
- If you want the profile to expire, enter “Profile expires on”. When the date is reached, the account returns by itself to the public profile and the person is notified. Leave it blank for it not to expire.
- Click “Create user”. The system generates a temporary password and shows it only once: copy it with “Copy” and hand it over through a secure channel. If you close the notice without copying it, it will have to be reset.
The person must change that password the first time they sign in.
Editing, resetting and deactivating
- Edit: changes the name, the profile, the details and the “Active account” checkbox. A deactivated account cannot sign in, but retains its history. Click “Save changes”.
- Reset password: generates another temporary password. The current one stops working immediately and the new one is shown only once.
- Deactivate account: the account can no longer sign in, but its history of actions is retained, because in an institution it must be possible to answer who did what.
On the 1st of each month the administrator receives by email the list of accounts with internal access to review (this requires the mail server to be configured).
“Edit my details”
On your own row the “Edit my details” button appears. Each person can correct their personal data and their email. They cannot change their profile or the status of their account: that is done by someone of a higher rank. The password is changed under “My Password”.
My password
Click “My Password” in the header. Enter the current password and the new one twice. The new one must be at least 10 characters long, with lowercase letters, uppercase letters and at least one number, and be different from the current one. If your password is temporary, the system will ask you to change it before continuing.
The same screen offers “Delete my account”: it erases your personal data (ID number, names, date of birth, phone and entity) and your account stops working. It asks for your password as confirmation and cannot be undone.
Profiles and permissions
A profile is a named set of permissions. The permissions are defined by the system (for example, view the catalog, upload data, publish and withdraw, edit records, manage styles, view downloads, manage users, manage profiles, view the audit trail, manage the assistant, manage imagery providers, manage external services, use the assistant, record field events and review field events). New permissions are not invented from the screen; profiles are created.
- New profile: enter a stable key in lowercase, a name, a description, the rank and tick the permissions. Delicate permissions are marked “sensitive”.
- Edit: changes take effect immediately for those who have the profile, because permissions are read on every request.
- Protected profiles: “administrador” and “publico” cannot be deleted or deactivated, and the administrator cannot be left without the permissions to manage users and profiles. This way the system is never left without someone to govern it.
- Delete a profile asks for confirmation.
Profiles that the system ships with by default, which you can edit: Administrator, Technician (uploads, documents and publishes layers), Content editor (uploads and documents, but does not publish), Query (read-only access to the internal catalog) and Public (registered account without internal access).
Audit
The “Audit” screen answers “who did what and when”. It separates staff activity from that of visitors without an account.
What it records
- Access: sign-ins, failed attempts (with the reason: the account does not exist or the password is incorrect) and sign-outs.
- Portal use: layer queries, searches, spatial queries, use of external services and downloads.
- Layer administration: creation, editing of data and metadata, style changes, publication, withdrawal, decommissioning, restoration, visibility changes and publication of snapshots.
How to consult it
- Choose the period with “From” and “To”, or with the shortcuts “Today”, “7 days”, “30 days” and “One year”.
- Filter by “Who” (everyone, only with an account, only anonymous, or one person), by “Layer” and by “Action”.
- Review the indicators (sign-ins, distinct people, queries, downloads), the activity per day, the most used layers, where access comes from and the list of latest events with their detail.
- To take the result to another program, use “Export to Excel” or “Export to CSV”.
Regarding origin, only the source network is stored (the truncated IP), never the full address. Even so, together with the email and the time, this screen is a record of personal data: limit its access to the profile that audits.
Retention
The record of accesses and queries is recycled every year: 12 months are kept. The history of changes to layers and that of downloads is not recycled, because they are the memory of a published dataset.
Summary
- You see and manage only those with a rank lower than yours, in addition to your own account.
- When you create a user or reset their password, the temporary password is shown only once.
- Each person corrects their data with “Edit my details” and changes their password under “My Password”; they cannot change their profile or status.
- Profiles group permissions; “administrador” and “publico” are protected.
- The audit records access, use and changes; it can be filtered, exported to Excel or CSV and is kept for 12 months.
Chapter 15
System settings
In Tesela, people are managed under “Administration” and the system is adjusted under “Settings”. This side-menu group brings together what changes how the portal looks, what it offers and where it obtains data from, without touching code or deploying anything. This is a chapter for administrators.
The “Settings” group is seen by whoever manages profiles. “Imagery providers”, “External services” and “AI assistant” additionally require a permission of their own, because they decide where data comes from or what is sent to a third party.
Site identity
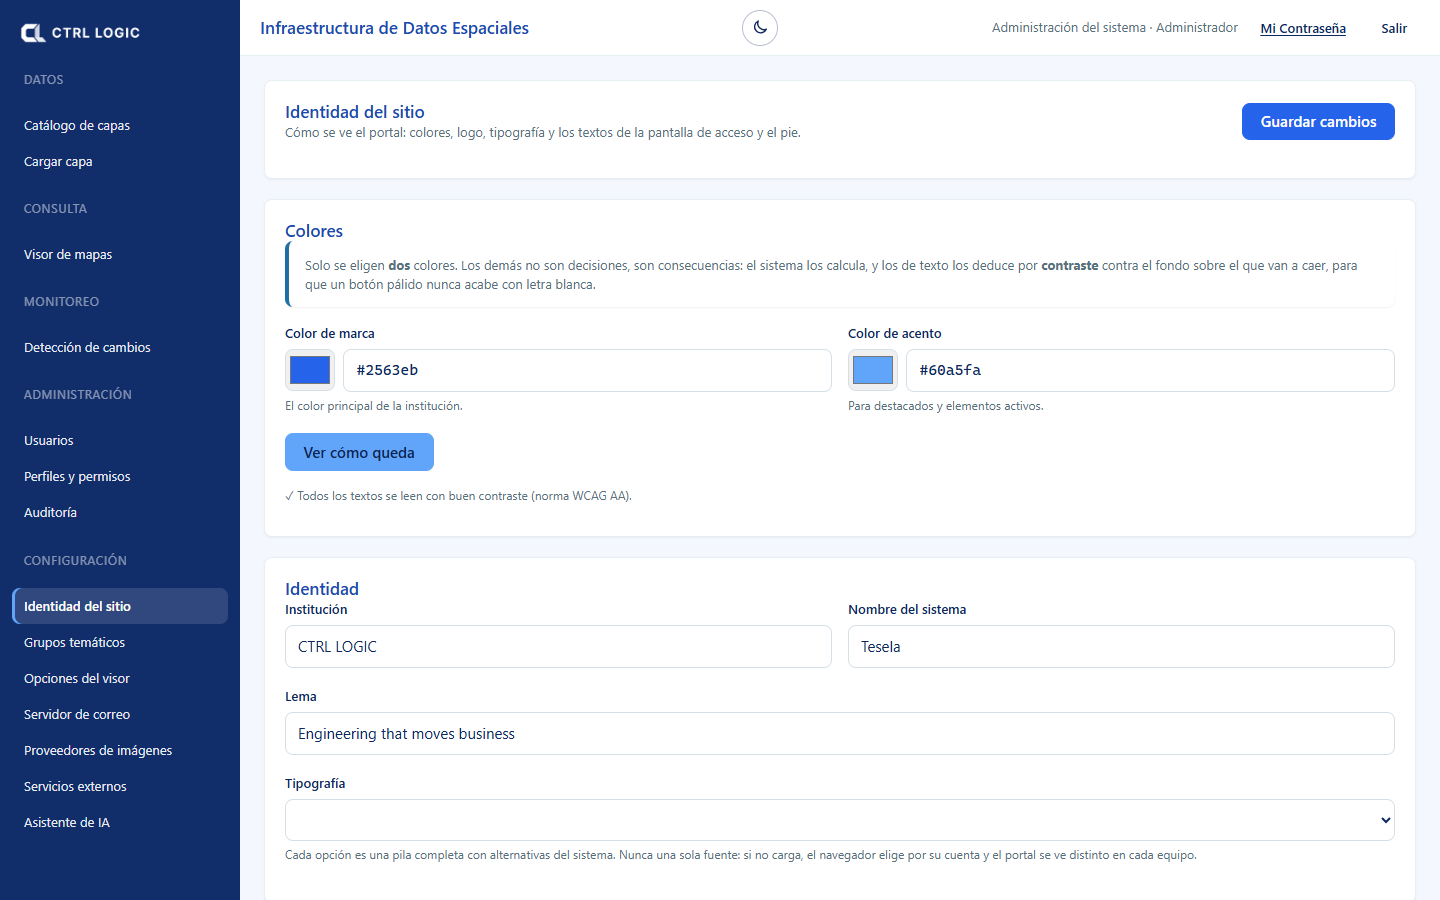
Defines how the portal looks: colors, logo, typography and the texts of the sign-in screen and the footer. Changes are visible immediately across the whole portal when you click “Save changes”.
- Colors: only two are chosen, the “Brand color” and the “Accent color”. The others are calculated, and text colors are derived by contrast. “See how it looks” applies a preview that only you see until you save. The system checks the contrast against the WCAG AA standard and warns you if a combination is hard to read.
- Identity: “Institution”, “System name”, “Tagline” and “Typography” (Inter, system, Source Sans or Serif).
- Images: “Logo” (menu, headers and PDFs), “Tab icon” (favicon), “Light version of the logo” (over the dark sign-in panel) and “Sign-in background image”. Each is uploaded with “Upload” or “Change” and removed with “Remove”.
- Sign-in screen: headline, message and the color overlay on the background image (color and opacity).
- Contact and footer: email, phone, address and footer text.
Thematic groups
Groups are the folders of the viewer’s layer tree. Whoever uploads a layer chooses its group from this list, so variants such as “Geología” and “Geologia” do not appear. Here you can create a group (“New group”, with a “Suggested ISO category”), rename it, deactivate it and change its order with the up and down arrows: the order of the table is the order in the viewer. If the name resembles an existing one, the system asks “Is it the same group?”. Renaming a group applies the change to all its layers at once.
Viewer options
Decides which tools the viewer offers to each type of visitor. Each tool has three levels:
| Level | Who sees it |
|---|---|
| Public | Everyone, without signing in. |
| Signed-in only | Staff who sign in. |
| Hidden | Nobody: it is removed from the viewer. |
The options are grouped under “Navigation”, “Query and analysis”, “Tools” and “Downloads and services”, and include those covered in this manual: “Assistant”, “Drone mission planner”, “Field observations”, “Hotspots (NASA FIRMS)”, “Data sources and licenses” or “Monitoring: change detection”. The functions without which the map cannot be used (viewing all of Bolivia, zooming in, zooming out and identifying) are always public. Click “Save changes”: the viewer applies them on the next load.
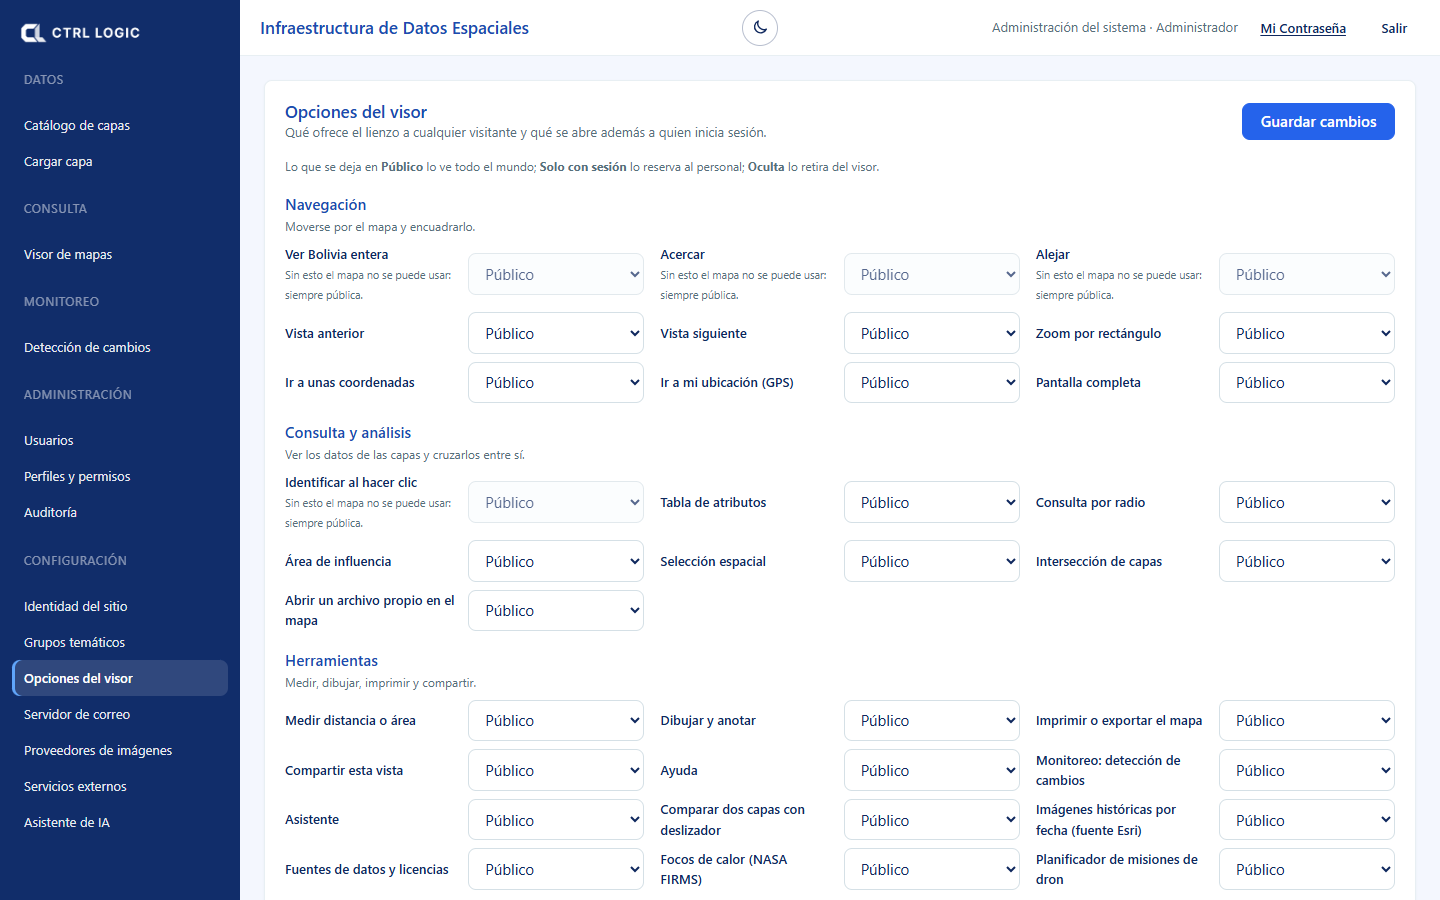
Some tools additionally depend on a permission. For example, “Field” appears only to those who can review field data, and the assistant to those who can use it, even if the option is public.
Mail server
Activation codes, password recovery and the monthly review of internal access go out through here. As long as it is not active, the portal does not offer account creation or password recovery.
- Fill in “Server”, “Port” (587 with STARTTLS or 465 with encryption from the start), “Username” and the password. The password is stored encrypted and is never shown again.
- Enter the sender’s name and email, and the “Administrator email”, where the list of accounts with internal access arrives on the 1st of each month.
- Save and click “Send test email”. Only when the test works does the server go into use.
Imagery providers
Indicates where the satellite imagery for the analyses comes from. Each analysis stores the provider with which it was made, so turning off or editing one does not change earlier results.
| Provider | Note |
|---|---|
| Copernicus Data Space (openEO) | Processes on the Copernicus service. Requires OAuth credentials on the server. It is the default. |
| Earth Search (Element84, STAC) | Open catalog on AWS. Requires no key. |
| Google Earth Engine | Composites on Google’s side. Requires a project registered by the institution. |
For each provider you can “Test connection”, “Turn off” or “Turn on”, “Make default” and “Edit” (name, address and collection). Credentials are not entered in the interface: they are configured on the server.
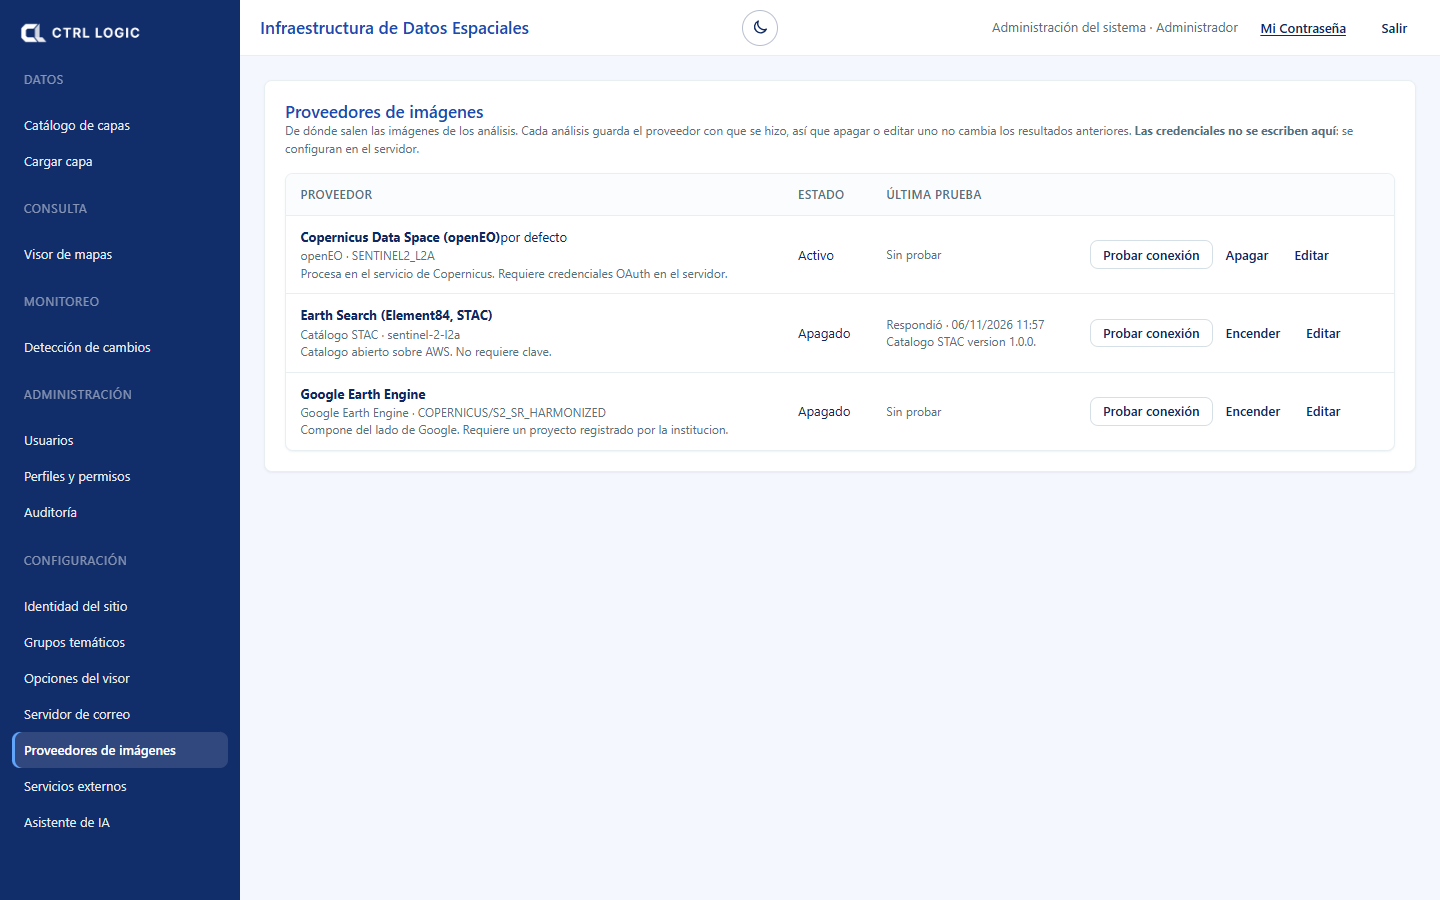
External services
Allows the viewer to display map services from other institutions (WMS, WFS or XYZ tiles). The data belongs to third parties and is read-only: the API queries it from the server and the browser never connects to it.
Registering a WMS service
- Under “Register a service”, choose the “Service type” (WMS) and enter the “Address”, normally ending in “/wms” and without parameters.
- Enter the “Institution that owns the data”. It is shown next to each layer and in the map attribution; respect the service’s license. Optionally, add a “Usage warning” or a “Credential” (Authorization header, which is stored encrypted).
- Click “Test connection”. If it responds, you will see the service title and how many layers it publishes.
- Click “Register service”.
- Under “Registered services”, open the service and tick the layers that are offered in the viewer (“Layers offered in the viewer”).
- Each service is created as “Internal” and with its layers not offered. If you want any visitor to see it, click “Make public” and confirm. A service with a credential cannot be public.
Once registered, you can “Check” that it still responds and that its catalog has not changed, “Turn off”, “Turn on”, “Edit” or “Remove” (its layers stop being shown).
AI assistant
Here you choose the model provider (Claude from Anthropic, ChatGPT from OpenAI or Gemini from Google) and its key. The key is stored encrypted on the server and does not leave it. The steps and the privacy notices are in the chapter “Assistant”.
Summary
- “Site identity” and “Viewer options” change the appearance and the tools without deploying anything.
- “Thematic groups” orders the layer tree.
- The “Mail server” must be tested for registration and password recovery to work.
- Imagery provider credentials are configured on the server, not on the screen.
- External services are created as internal; make them public only after reviewing their license.
Chapter 16
FAQ, glossary and limits
This chapter brings together the most common questions, the meaning of the technical terms you will see in Tesela and the limits of the system, stated plainly from the start. Knowing what can be seen and what cannot is what allows you to trust what can be seen.
Frequently asked questions
Does Tesela tell me whether an activity is illegal?
No. Tesela detects indications: alterations of the territory or activity consistent with something, and prioritizes them to decide where to look first. Every detection requires verification. The conclusion is reached by the competent institution through its own procedure. It is a technical support tool; it does not replace administrative procedures or field inspection.
Does detection use artificial intelligence?
No. Detection is mathematical and explainable: spectral indices are calculated on satellite images and thresholds are applied. You can see from which scenes, with which parameters and when each result was produced. Artificial intelligence is used only in the “Ask the map” assistant, which only reads and queries.
Why does an alteration that I know exists not appear?
It may be due to the resolution of the images (a very small intervention is not visible), to clouds during the chosen period, to a threshold that is too high, or because the alteration occurred outside the dates compared. Try other periods or adjust the thresholds; the “Honest limits” section explains each cause.
Why does an analysis take a while?
Analyses are processed in the background and request the imagery from the configured provider. The sheet or the monitoring panel shows progress by stages. A long period or a large area takes longer.
What is the difference between a live layer and a snapshot?
The live layer changes when new data arrives and is for exploring. The snapshot is a frozen, immutable copy, with a record and SHA-256 fingerprint, and is for delivering or citing. See “Snapshots and sources”.
I do not see a tool that another person sees. Why?
Each tool can be public, signed-in only or hidden (administrator, “Viewer options”), and some additionally depend on a permission in your profile: “Field”, “Assistant”, “Monitoring”. Ask the administrator if you need it.
What do I do if the assistant shows “The request cannot be processed right now”?
Contact the administrator. The assistant may not be configured, or there may be a problem with the provider; the detail stays in the server log and the person asking never sees it.
Can I cross-reference the results with official concessions or cadastres?
Only if the institution that owns the data authorizes it through an agreement. Official third-party data is always used in read-only mode. The protected areas in the demonstration come from OpenStreetMap and are indicative, not official.
Can I use Tesela on an iOS phone?
The “Tesela Field” field app is available for Android. The iOS version is on its way.
Glossary
| Term | Meaning |
|---|---|
| Indication | A detected signal that suggests an alteration or activity and that requires verification. It is neither proof nor a determination. |
| Requires verification | Notice that accompanies every finding: before acting, someone must check it against other sources or on the ground. |
| Sentinel-2 | Satellites of the European Copernicus programme that image the Earth’s surface with 10 to 20 m pixels. They are the source of Tesela’s scenes (level L2A, atmospherically corrected). |
| Scene | A satellite image of a period, or a composite of several dates, from which the indices are derived. |
| NDVI | Vegetation index: high values indicate dense, active vegetation; a drop between two dates may indicate loss of cover. |
| NDWI | Water index: highlights water bodies and moisture. |
| NDSI | Snow index: highlights snow-covered surfaces. |
| BSI | Bare soil index: highlights surfaces without vegetation. |
| NBR | Burn index: combines infrared bands to highlight surfaces affected by fire. |
| dNBR | Difference in NBR between before and after a fire. It is used to estimate severity; without local calibration it may underestimate it. |
| Severity | Class estimated from the dNBR (low, moderate-low, moderate-high, high). It is an estimate that requires verification. |
| Threshold | How much an index must vary to be considered a change. It is calibrated with real cases. |
| Heat hotspot | Thermal anomaly detected by satellite (NASA FIRMS). It is consistent with burning or other heat sources; each hotspot is an indication. |
| Snapshot | Frozen, immutable copy of the state of the data on a date, published as a layer with its record. |
| SHA-256 fingerprint | Digital signature of the content: if the data changes, the fingerprint changes. It makes it possible to verify that what was delivered is what was published. |
| ISO 19115 record | Standard metadata record that describes a layer: what it is, where it comes from, how it was produced and under what conditions it can be used. |
| WMS | Standard service that delivers maps as images. |
| WFS | Standard service that delivers vector features with their attributes. |
| GeoServer | Map server that publishes Tesela’s layers as WMS and WFS. |
| COG | Cloud-optimized GeoTIFF: the format in which rasters are stored so they display quickly on the map. |
| GSD | Size on the ground covered by one pixel of a photo, in centimeters per pixel. The lower the GSD, the more detail. |
| Overlap | Percentage by which consecutive photos (front) or neighboring lines (side) overlap in a drone mission. |
| Live layer / reference layer | Live: updated with new data. Reference: context data such as boundaries or protected areas. |
| Profile and rank | The profile is a named set of permissions; the rank orders the profiles and limits whom each person can manage. |
Honest limits
- Resolution. Sentinel-2 pixels measure 10 to 20 m. Interventions down to fractions of a hectare are detected, but not small pits or activity under cover.
- Clouds. In tropical areas and in the rainy season there may be no clean image for weeks. This is mitigated by compositing several dates. Radar (Sentinel-1), which penetrates clouds, is planned but not yet available.
- Thresholds. How much an index must vary to be an alert cannot be guessed: it is calibrated with real cases. Without local calibration, severity may be underestimated.
- Official data. Cross-referencing the results with concessions or cadastres of another institution requires an agreement with whoever owns the data.
- Protected areas. The demonstration layer is indicative and non-exhaustive: its boundaries are not the official ones. The official layer depends on the source that each institution decides.
- Artificial intelligence. Detection does not use it. The assistant is optional, read-only and depends on the provider and key that the institution configures.
Cautious language
Tesela is written so as not to state what it cannot know. A satellite image shows that something changed, not why or whether it was permitted. That is why the system and this manual speak this way, and we ask that your reports do so too:
| Instead of… | Write… |
|---|---|
| “Illegal mining” | “Anomaly detected” or “territorial alteration” |
| “Criminal activity” | “Activity consistent with…” |
| “Confirmed exploitation” | “Possible activity…”, “requires verification” |
| “Proof of a crime” | “Indication that requires verification” |
| “Detects offenders” | “Prioritizes areas for inspection” |
Summary
- Tesela prioritizes where to look; the decision and the verification belong to people.
- Detection is mathematical; AI is only in the query assistant.
- Know the limits: resolution, clouds, thresholds and official data subject to agreements.
- Always speak of indications and verification.