
Chapter 2
The map viewer
The viewer is the central screen of Tesela: a map with a toolbar, a layer panel and a status bar. From here you query layers, measure and draw features, request change analyses and compare images. This chapter explains its parts; the tools are described in detail in chapters 3 to 8.
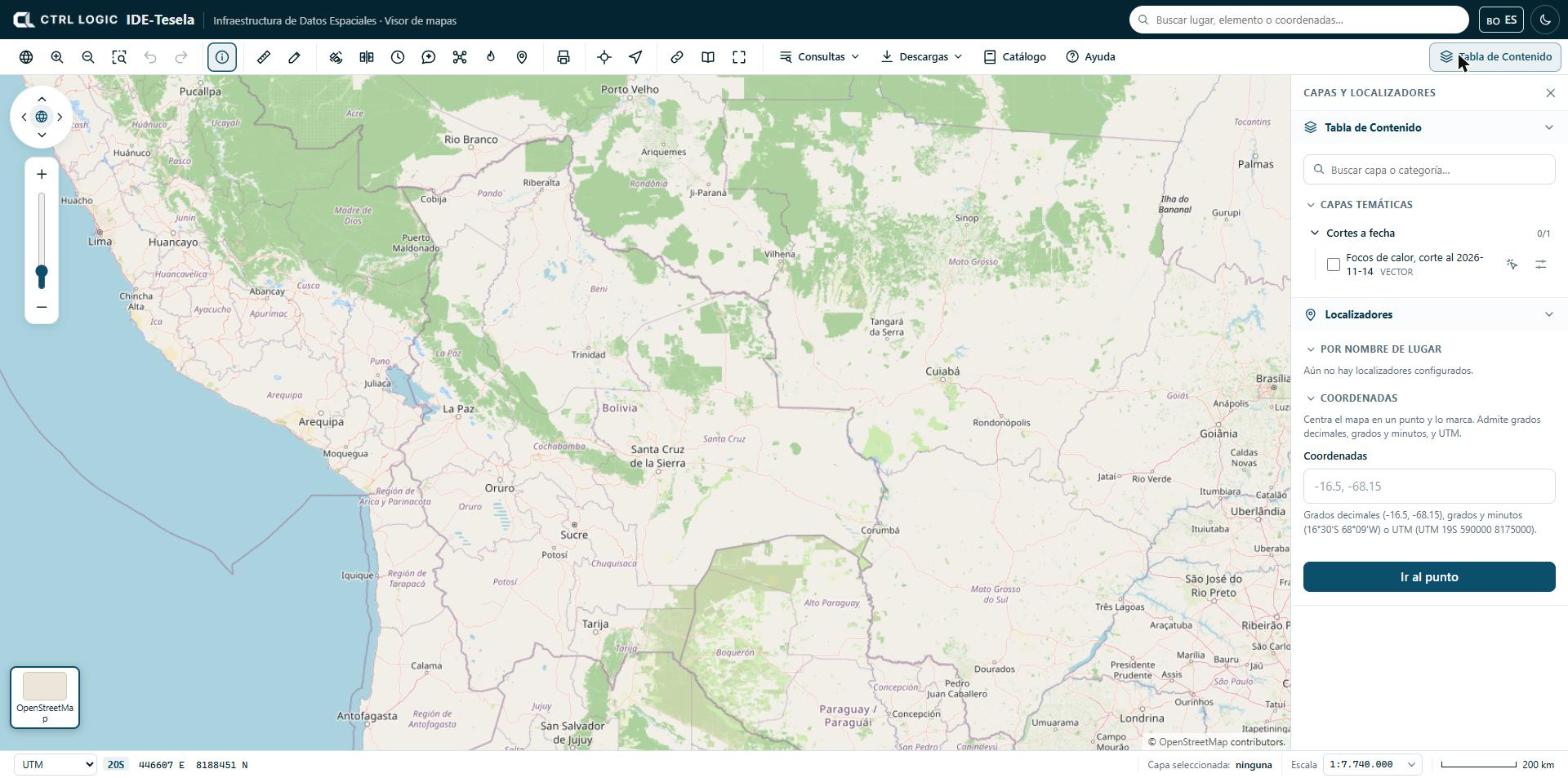
The toolbar
The toolbar sits below the header. Each button has a help text that appears when you hover over it. The buttons are grouped as follows:
| Group | Buttons |
|---|---|
| Navigation | “View all of Bolivia”, “Zoom in”, “Zoom out”, “Zoom to rectangle”, “Previous view” and “Next view” |
| Query | “Identify” |
| Measure and draw | “Measure” and “Draw” |
| Monitoring | “Monitoring” (detect changes), “Compare”, “Historical”, “Assistant”, “Drone” (drone mission), “Hotspots” and “Field” |
| “Print” | |
| Locate | “Go to…” (coordinates) and “My location” |
| Share | “Share”, “Sources” and “Full screen” |
| Menus | “Queries”, “Downloads”, “Catalog” and “Help” |
Not everyone sees every button. In “Viewer options”, an administrator defines which tools are public, which require a signed-in session and which are hidden. If a button is missing, your profile does not have it enabled.
The map also carries a navigation control (arrows to pan the map, a globe to return to the view of Bolivia and a zoom bar). With the map focused you can also use the keyboard arrow keys and the + and − keys.
The Table of Contents
The “Table of Contents” button (top right) opens and closes the “Layers and locators” panel. This is where layers are switched on and off.
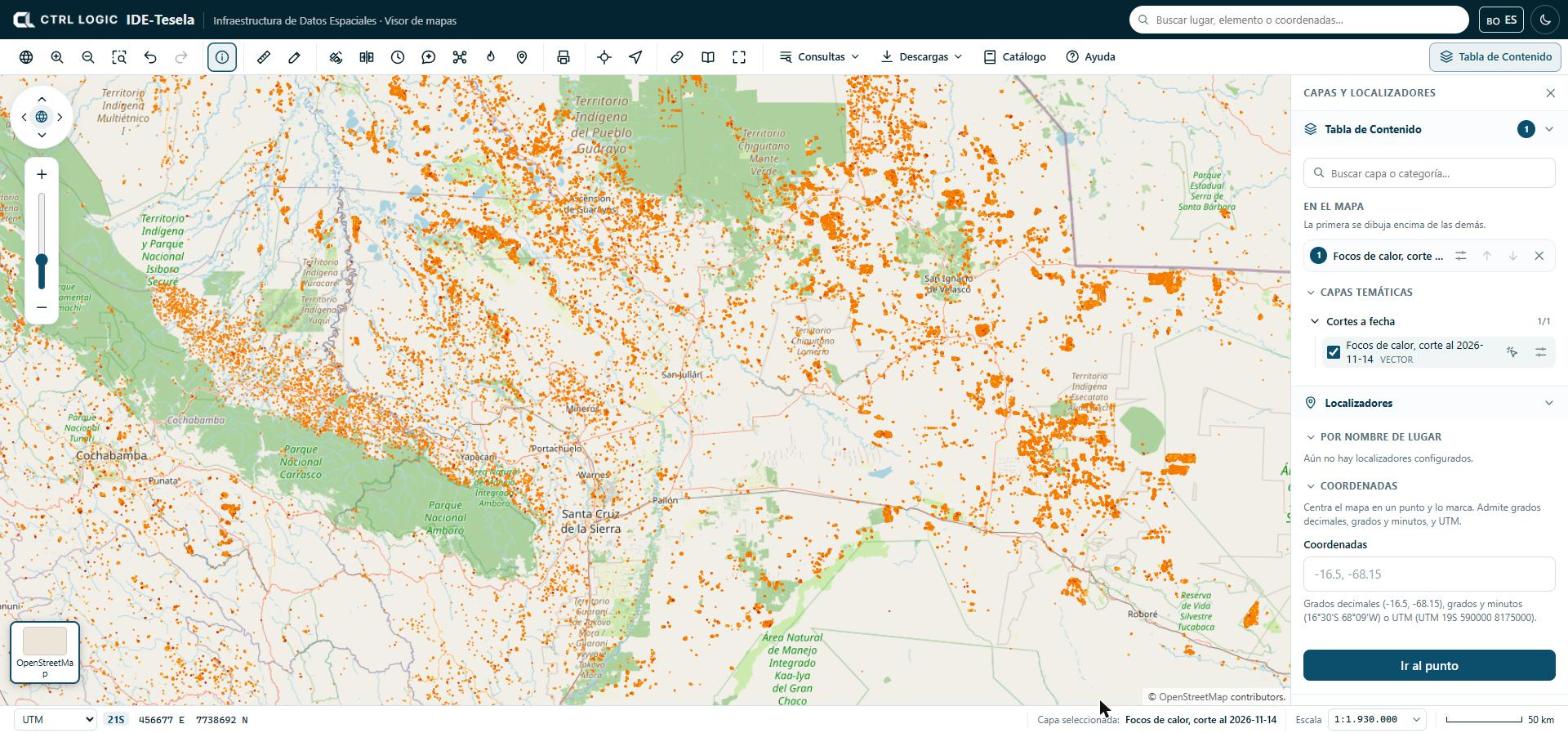
- Open “Table of Contents”. Layers are arranged in thematic groups (folders that expand; the counter, for example “0/1”, shows how many are switched on).
- Type in “Search layer or category…” to filter the list.
- Tick the checkbox of a layer to switch it on. Each layer shows whether it is vector or raster; layers visible only to signed-in users carry the “Internal” label.
- In the “On the map” section, order the layers that are switched on: the first one in the list is drawn on top of the others. Use the arrows to move a layer up or down and the ✕ to remove it.
The options button of each layer expands its settings:
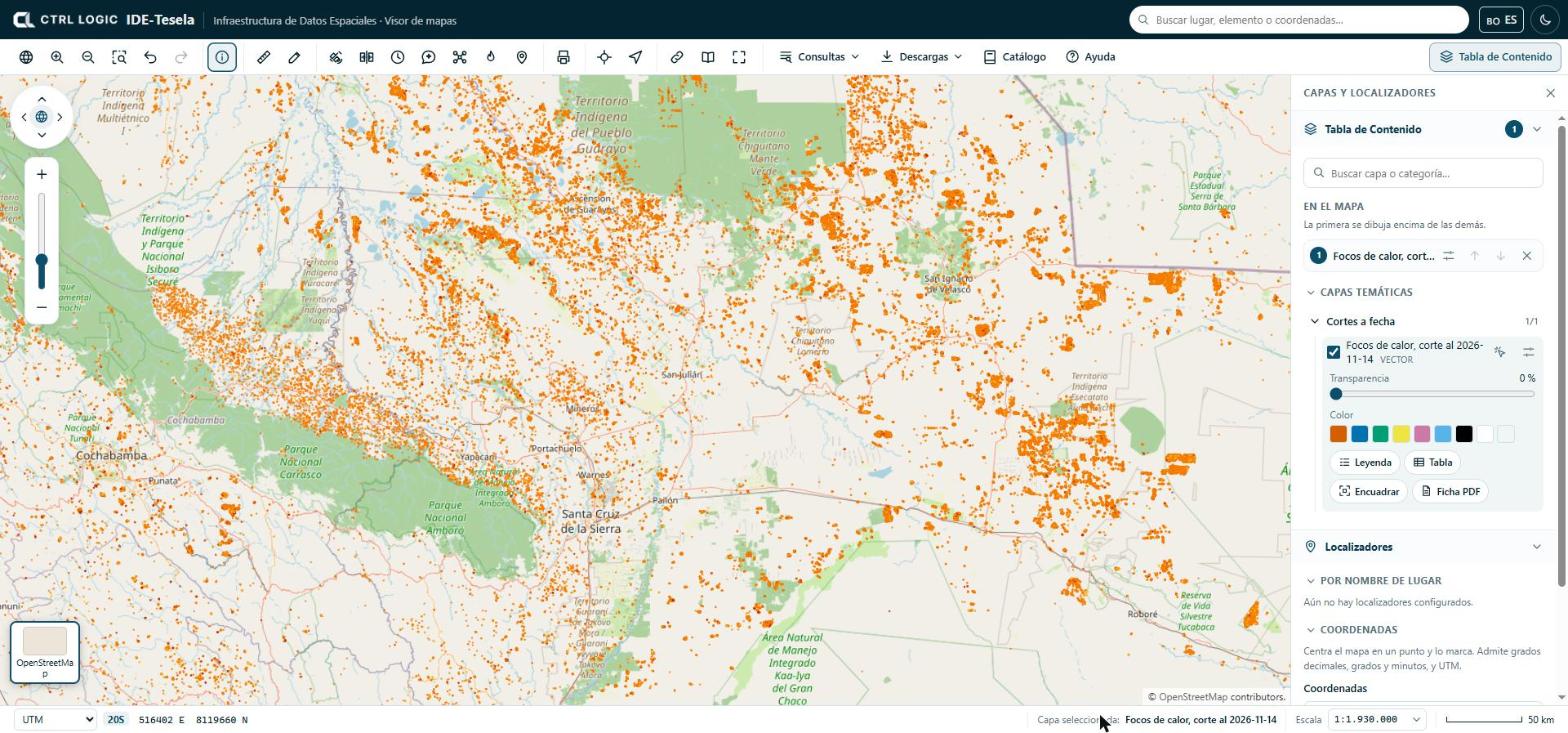
- Transparency: from 0% (opaque) upward, to see what lies underneath.
- Color: changes the color of a vector layer. “Back to the official style” restores the original.
- Legend, Table (attribute table), Zoom to extent (takes the map to the extent of the layer) and PDF sheet (the layer’s technical sheet).
- The “Queryable” icon makes a click on the map query only that layer. Its name appears at the bottom, in “Selected layer”. Click it again to query all the layers that are switched on.
The Table of Contents also lists any local files you open (see chapter 3), your drawings under “My drawings” and, if your institution has enabled them, the “Third-party layers” (chapter 4).
Base map
The thumbnails in the lower left corner let you change the map background. Click the active thumbnail to expand the list:
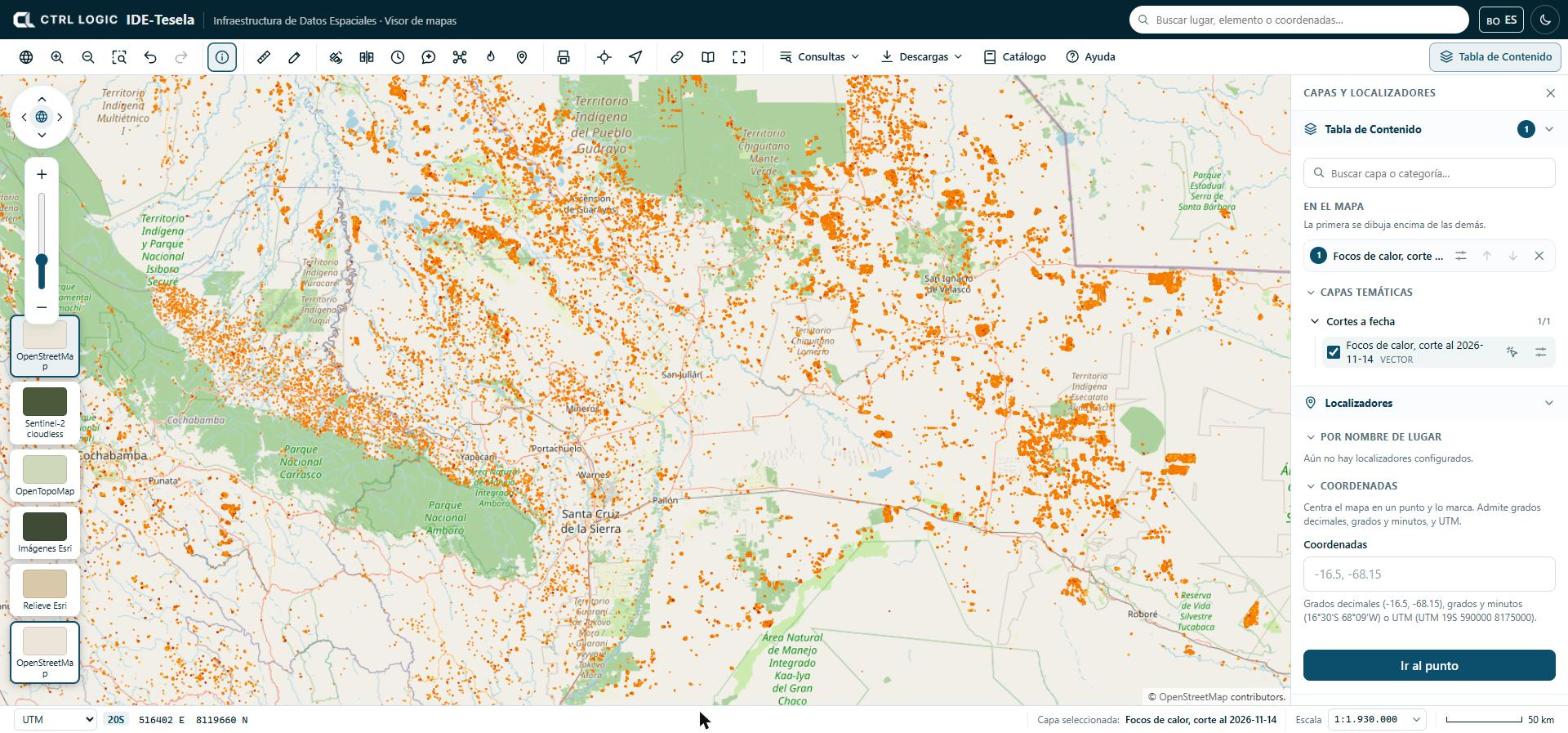
The base map is only the background: it is not part of the analyses. It is cited in the map attribution and in the PDFs you print.
Searching for a place or coordinates
There are three ways to go to a location:
- Header search box (“Search places, features or coordinates”): finds features in layers that have search fields configured, catalog layers and coordinates. If no layer has such fields, the search box tells you so and still accepts coordinates or the name of a layer.
- “Locators” panel, below the layer list. “By place name” offers chained lists (for example department and then municipality) if the administrator configured them. “Coordinates” centers the map on a point and marks it.
- “Go to…” button on the toolbar, which opens the same coordinates box.
Coordinates can be entered in three formats: decimal degrees (-16.5, -68.15), degrees and minutes (16°30'S 68°09'W) or UTM (UTM 19S 590000 8175000). The system tells you how it understood what you typed. If the point falls outside Bolivia, it warns you in case a sign is wrong: in Bolivia the latitude is south and the longitude is west.
- Open “Locators” in the panel or click “Go to…”.
- Type the coordinates in the box.
- Click “Go to point”.
“My location” uses your device’s GPS; it works only over a secure connection (https) and if you grant permission to the browser.
Status bar: coordinates and scale
The bottom bar shows three items:
- Coordinate system: choose between “Decimal geo.”, “DMS geo.” (degrees, minutes and seconds) and “UTM” (with its zone). The coordinates you see correspond to the cursor position.
- Selected layer: which layer is queried when you click.
- Scale: you can type a scale (for example
1:25,000,25000or25k) and press Enter, or choose one from the list. Next to it is the graphic scale bar.
Summary
- The toolbar groups navigation, query, measurement, monitoring, printing and menus; what you see depends on your profile.
- Layers are switched on in the Table of Contents and ordered under “On the map”; the first one is drawn on top.
- The base map is changed with the thumbnails in the lower left corner.
- To go to a place, use the search box, “Locators” or “Go to…”.
- The status bar shows coordinates, the selected layer and the scale.