
Chapter 7
Heat hotspots
The “Hotspots” tool shows the thermal activity detected by satellites, taken from NASA FIRMS (VIIRS sensor). It lets you see how many hotspots occurred in a date range, where they were concentrated and in which municipalities and protected areas they fall. A heat hotspot is thermal activity consistent with burning or other heat sources. It is an indication and requires verification: it does not indicate the cause or the legality.
Opening the panel and choosing the range
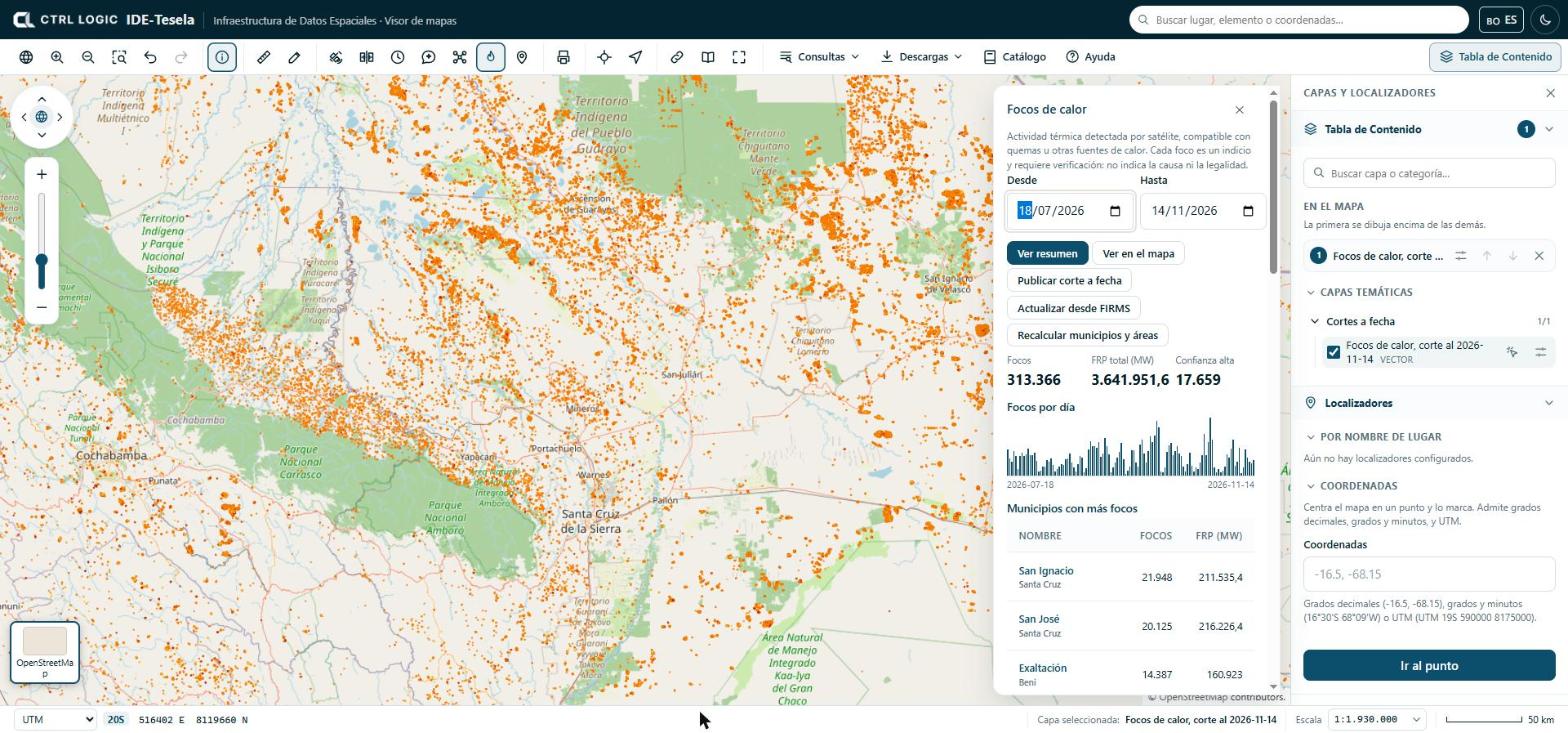
- Click “Hotspots” on the toolbar (“Monitoring” group).
- Choose the “From” and “To” dates. The range cannot exceed one year; if the start date is later than the end date, the panel tells you.
- Click “Show summary” to see the figures for the range.
- Click “Show on the map” to draw the hotspots as a layer. The layer is named “Hotspots · [from] to [to]” and appears under “On the map”.
How to read the summary
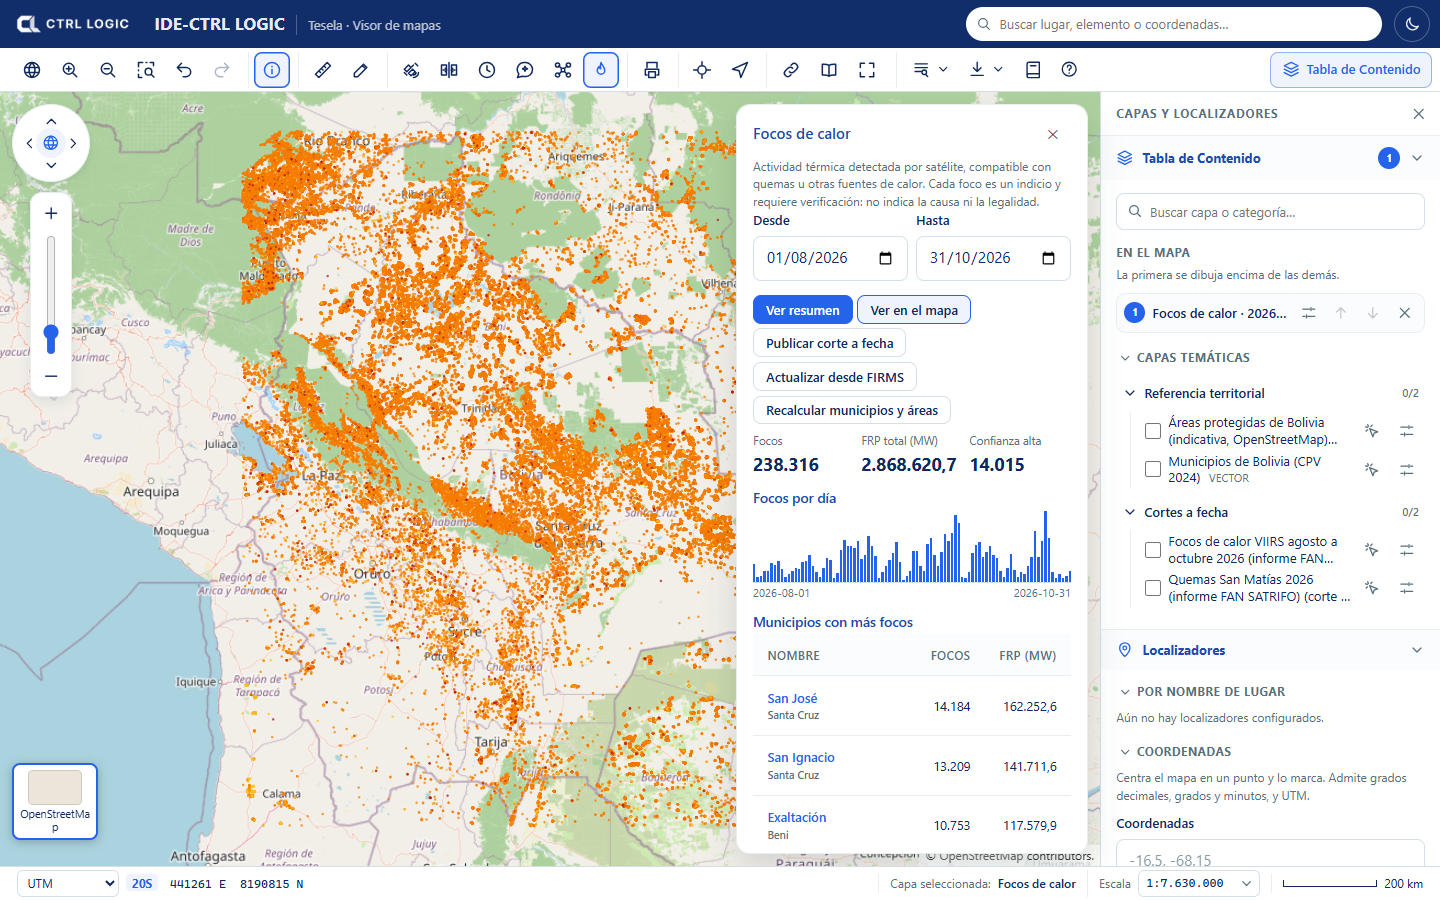
- Hotspots: number of hotspots in the range.
- Total FRP (MW): sum of the fire radiative power, in megawatts. It measures the energy emitted by the thermal activity, not its size or its cause.
- High confidence: how many hotspots the provider rates with high confidence.
- Hotspots per day: bar chart. When you move the cursor over a bar you see the date and the number of hotspots.
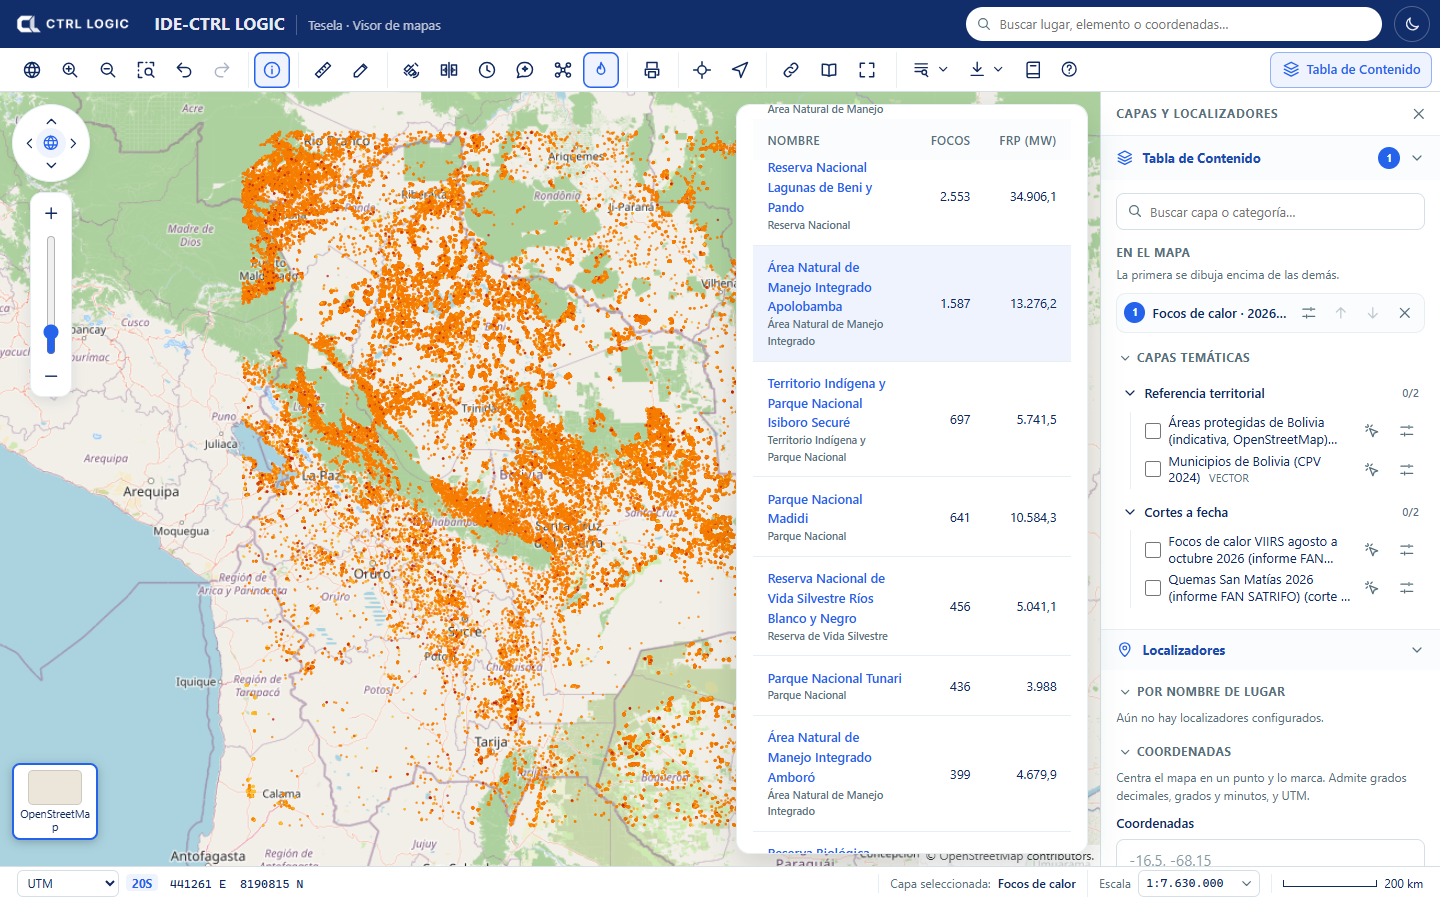
- Municipalities with the most hotspots and Protected areas with the most hotspots: tables with the number of hotspots and the FRP of each unit.
Cross-references with municipalities and protected areas
Each hotspot is cross-referenced with the catalog’s reference layers: it is assigned its municipality and, if it falls inside one, its protected area. The “Municipalities with the most hotspots” and “Protected areas with the most hotspots” tables are sorted from highest to lowest. When you click the name of a unit, the map is filtered to the hotspots of that zone (“Filtered by: …”); “Remove filter” shows them all again.
If the cross-reference shows notices, they mean the following:
- “The municipalities layer is not loaded yet”: results cannot be grouped by municipality until it is loaded.
- “No hotspot in the range falls inside a protected area”: this is a valid result.
- “N hotspots fall outside the loaded municipalities”: the municipalities layer does not cover that point.
Data update
Below the figures, the “Data update” block reports the last FIRMS download (date, origin and status), whether an automatic download is scheduled and when the last cross-reference with municipalities and protected areas took place. People with permission can:
- “Update from FIRMS”: requests the download of the hotspots for the range. It is queued and you should query again in a few minutes.
- “Recalculate municipalities and areas”: redoes the cross-reference of each hotspot with the layers loaded now.
- “Publish snapshot”: freezes the state of the hotspots in a new, immutable layer (chapter 12).
If you do not see those buttons, your profile does not have them enabled. If the range has no hotspots loaded, the panel suggests trying other dates or updating from FIRMS.
Cautious reading
A hotspot is a thermal detection, not a confirmation of burning or of its origin. It may correspond to a burn, to another heat source or, at times, to a false detection. It is useful for deciding where to look first and is cross-checked against imagery (chapters 5 and 6) and, where it matters, against field verification.
- Each “Identify” card on a hotspot includes source, satellite, date and time, brightness, FRP, confidence and whether it was day or night.
- A hotspot near or inside a municipality or protected area is a spatial coincidence that requires verification; it attributes facts to no one.
- Hotspots are points of about 375 m resolution: they do not delimit the burned area. The burn analysis is for that.
The source and attribution of the data are: NASA FIRMS (LANCE, EOSDIS), open NASA data. Cite them when you reuse them. The “Sources” panel (chapter 3) shows the license and attribution of published snapshots.
Summary
- “Hotspots” shows the thermal activity from NASA FIRMS (VIIRS) in a date range of up to one year.
- “Show summary” gives the total hotspots, the FRP, high confidence and the per-day series; “Show on the map” draws the layer.
- Hotspots are cross-referenced with municipalities and protected areas and can be filtered by zone.
- Each hotspot is an indication and requires verification; it indicates neither cause nor legality.